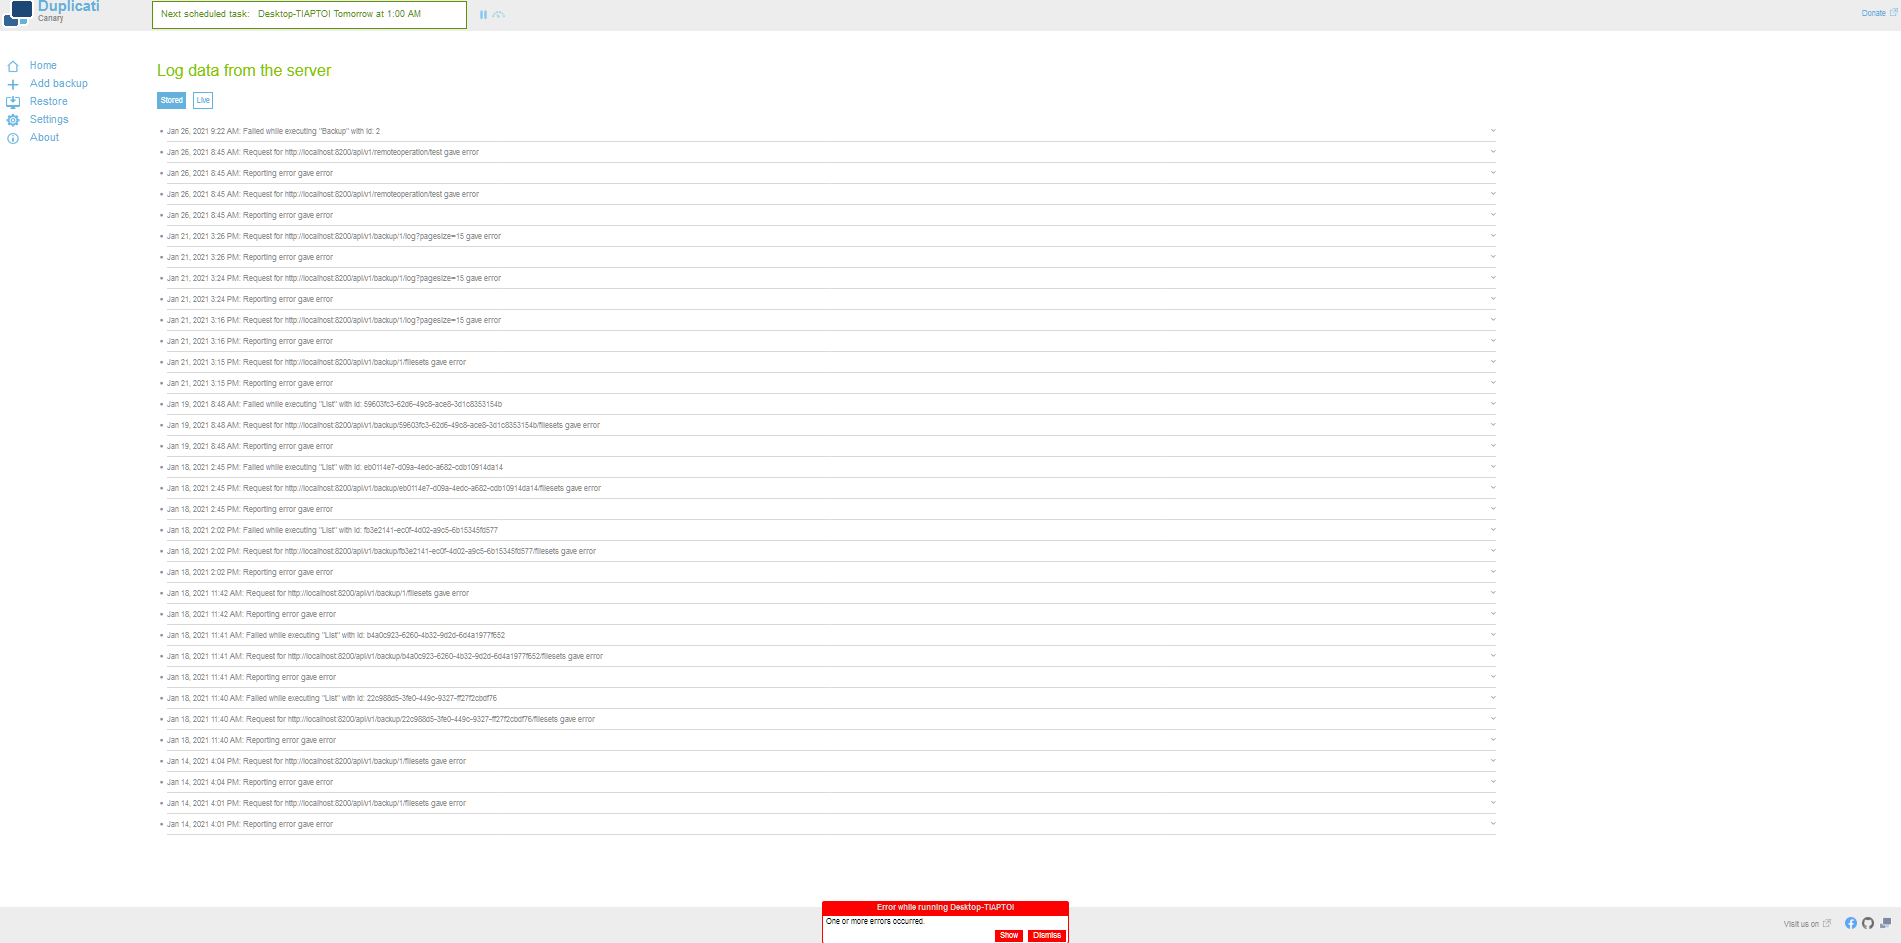
Is there a reason, there’s no option to see the whole log file in Duplicati?
Seeing as how there’s an error in the logfile, but “Show Error” doesn’t show the error, because it doesn’t match the 2 filters that are available. Sometimes helping is not helping at all.
IS there a default logfile?
I know how to specify one, but when I have to be able to write a detailed description of how to set this up for other techs to follow, and they are too lazy to read the whole thing, it would be nice to know where the default logfile is so I can check that.
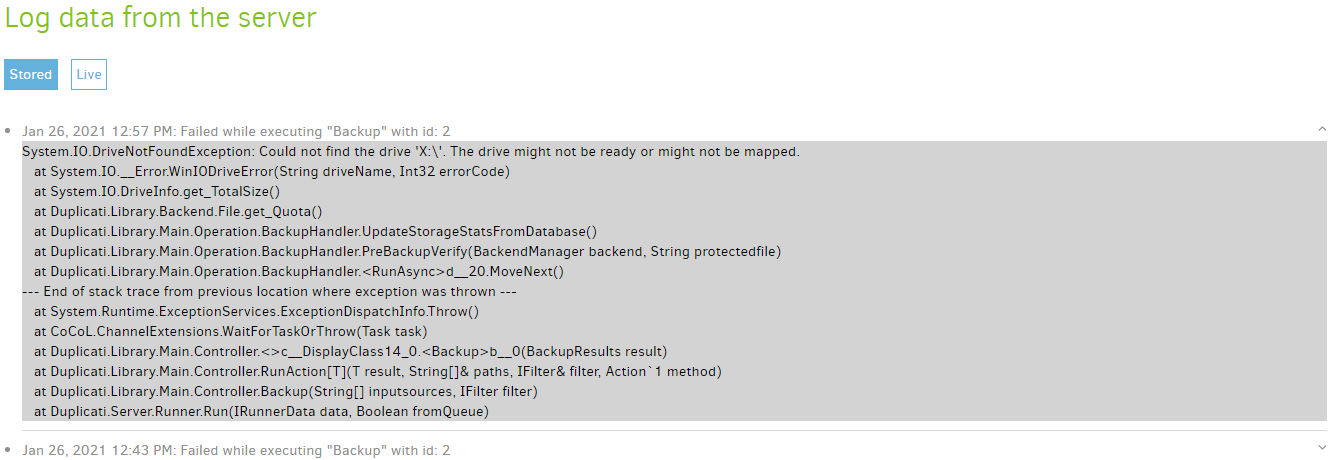
For instance, My current test failed because of B2 Caps that are set by default. However, there’s no way to see that in the Duplicati web interface that I can tell. If I hadn’t specified the logfile, and went to the raw log, I wouldn’t know why it failed, as there is no available data in Duplicati’s interface. It just appears to fail without reason.
Making it harder to find the necessary info is not helpful. Yeah, it looks pretty, but it won’t print pretty anyways, so why bother. Most people that would be using this product at this time, are used to reading logfiles.
Just a quick option to display the unformatted logfile would be helpful. (Or as a scrollable <pre> region)
I’m not following what this refers to. Can you clarify? I do know there are two logs, and that’s a headache.
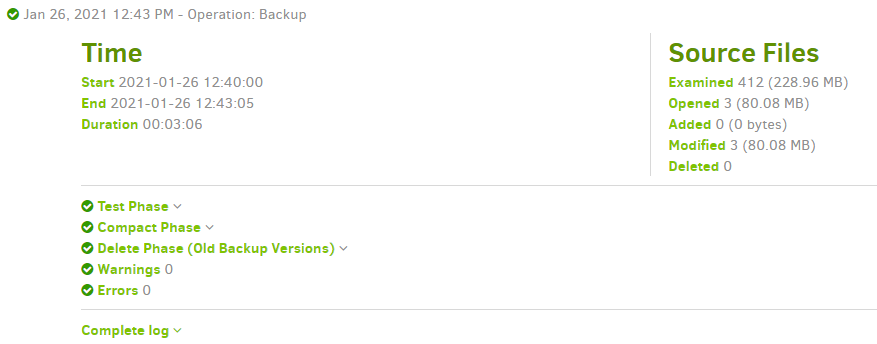
Backup errors might not produce a log in the per-backup logs, but go to server log at About → Show log.
Clicking Complete log will get the not-very-pretty version of the log. There’s no more log kept by default, which does make troubleshooting harder. Even the not-pretty log tends to only have first line of the errors.
Sometimes I have to step people through reproducing an issue for About → Show log → Live → Warning.
One way to get someone a nicer level of detail without setting up a logfile is to set up Reporting options which on an error seems quite good about scraping some useful information together and getting it to you directly or through some helper such as dupReport or duplicati-monitoring.com, which add more features.
If you think there should be more logging than currently, that’s a different issue. And what are these filters?
When I’m in the log for the backup job. All it shows is a filtered version of the log file.
I didn’t know I had to go to a completely unrelated section, to see the whole logfile. Why not a link here on the log screen for the job? Having to go back and forth to different sections for related information makes no sense.
OR, when I click show me the error, take me to the correct log to see the error.
You object to going to the bottom of a log screen? That’s like “a link here on the log screen for the job?”.
Combine logs in GUI #1152 would at least get the correct log. Whether or not it has enough info is TBD.
EDIT:
If you have objections to the log screen layout, which looks pretty reasonable to me (progressively more details) please elaborate exactly what changes you have in mind, preferably in a specific Features or UX topic. Or if we can solve that here, you might be able to change category of this topic or I could do that…
This is the log screen from the job. As you can see there is no Link to the whole log.
Just Local and Remote at the top.
I get a notification at the bottom of the screen that there’s an error, when you click “Show” the error, it takes you to this screen. There is no place on THIS screen to see the full log. You must exit the job, (Home, then go to About, Then Show Log.) IF the error button actually took me to the actual Log Screen, maybe that would be better. But as you can see, from the JOB Log screen, there is no way to see the whole log. It’s in a separate place.
EDIT: One user-unfriendliness of the server log is that it references backups by number, which you must decode by guessing on the home screen, e.g “Show log” button for a job will give a URL with job number.
EDIT 3: I think the –server-log is even worse as the jobs are mixed, unlike with the log-file per-job log files.
i have used the log-file on the job. And ALL the logs are in that file. Of course, this is the only job I have. I’d hate to see the scenario you are talking about with mulltiple backups on one server. Although I suspect that may be the only way to successfully backup everything on larger servers, is breaking it down into smaller jobs. My larger size jobs just quit, and never restart, and nothing shows in the logfile, other than, unexpected program termination. (I suspect interference from AV on this one). I have yet to get a full backup without errors on any site. I have 30 of them setup. I have specified Verbose, and a log-file on each to try to narrow it down. I have one that apparently times out on the backend, and b2 closes it because their pipe is just too slow. Even if I throttle duplicati back to < 1k and 1 instance, they lose their phones and other services. So they login and kill the job, and then wonder why they don’t have backups. (They don’t beleive in pausing it, and resuming it). For them it’d be nice for an autopause on the backup from Time a, to time b on weekdays, and time c to time d on weekends.
Maybe that’s doable. I haven’t figured out how to get a straight backup on a fat pipe to work yet.
A lot of mine are just test jobs, some intended to fail. It’s odd. More normal is redundant backups, or sometimes split backups rather than one huge one. Very large backups get slow at default settings.
Increasing blocksize helps a lot, otherwise the 100 KiB blocks turn into too much tracking overhead.
Can you provide any error messages? “unexpected program termination” never occurs in the forum.
Or do you mean that the logfile is logging job normally, but then just stops and the next backup runs?
Any idea how slow? If you mean they run IP phones, it must have some capacity, yet configuration is
1k what? This sounds like throttle-upload. You mean you have it set like below and it starves phones?
Throttling is buggy (in 2.0.5.1 upload throttle throttles download too - fixed in Canary), but not that bad.
Phones quality might get a little worse with some traffic (due to jitter), but starving their other services?
Do you have access to systems to see what Task Manager or some other tool thinks Duplicati sends?
If a job runs over to the next 12 hour time frame,(past noon or midnight, noon in this case as my jobs start at 1am localtime) the job quits. Likely because b2 doesn’t like the connection staying open that long. But there’s nothing in the logfile, so I don’t know exactly.
If the job runs into too many files at once that should be excluded, it quits. (Tmp files, cache, etc.) I have selected exclude Temp files, system files, but when I look at “jobs that quite” the last thing it was doing was failing on jobs that are definitely in those categories. (Windows server.)
I suspect the thing with temp files is issues with saving of the exclusions if they were added as an edit, as apposed to remembering to do that on initial job setup, as my habit is to make sure I setup what needs backing up first before I select exclusions.
In both cases, because there was an error previously, the backup job refuses to restart automatically the next time, and waits for a manual request to restart the job. I.e. backups are “automatically” paused indefinitely.
I’d rather see, log the files that can’t get a lock to backup, skip, and move on to the next, and keep going. And some sort of testing on the pipe to see if the connection is still good every so many files. (A keep alive, or re-establish connection.)
At any rate, now that I know how to get to the log files it’ll be a bit better. But, even knowing where the log files are, I know some of this stuff just causes duplicati to quit and not restart. (I.e. applying an update seems to cause it to quit and never restart, it must be restarted manually, even if services are set to automatic, and the server reboots.)
Where “that long” might be 1 minute if connection is made at 11:59. This makes no sense.
There was a report once (I think) of an Internet connection that was deliberately reset daily.
Doing that sort of cut at midnight might make sense, but doing it at noon seems really odd.
Unless there’s a 100% empty logfile, there’s something. What’s the end of the backup like?
Generally a backend issue is visible at Information level. Retry give a nicer view, and the
current logging at Verbose has even more. A B2 cut should show. Did you ask Backblaze?
I’m still wondering about the 1k. That would make default 50 MB block upload take 13 hours.
I guess it would guarantee you hit the noon/midnight weird cut (whose origin is mysterious).
Your Verbose log should show any uploads (or failures). Here’s sampler showing the levels:
You can estimate speed from the Started and Completed. Profiling output is huge, but you could use log-file-log-filter to capture just the speed reports. Does it seem like 1k is killing them, or is it too fast?
Speed estimation is tricky because by default there are 4 concurrent uploads, in order to add speed.
What does quit look like? Preferably include messages. If no messages, describe behavior.
That seems weird, but I should mention that in 2.0.5.1 the GUI editor puts out bad filter rules.
This is also fixed in Canary, but meanwhile use the three-dot Edit as text and see Filters.
There have been some issues with round-trip edits, e.g. building dropdown from text strings.
You mean the top of the screen looks like due to hitting Pause icon or another way?
One way a Pause can happen is if Settings asks for one, but it’s just on startups and wakes.
That’s what it does AFAIK (I just tested a case). It does make a warning (which some dislike).
Being able to send files tests that the connection is still good. A fail+retry does the re-establish. number-of-retries controls how many are tried before fail, and Verbose log will show every one. http-operation-timeout and http-readwrite-timeout can be used for super slow uploads, or using
OneDrive which has a 100 second timeout due to the different way it’s written. Most are longer.
My experience is that you can download and install, but it doesn’t activate when asked. It’s a bug.
I think it “sometimes” works. Fix was attempted, but caused worse problems so it was removed.
It’s a Windows service, right? Try changing it from Automatic to Automatic (Delayed Start).
If that helps, it’s because startup gets busy and it can’t finish within 30 seconds Windows allows.