Duplicati 2.3.0.4 on Fedora 43 high SWAP usage

Hi

Duplicati with - 2.3.0.4 - 2.3.0.4_stable_2026-07-09

When I output the below I notice high swap usage: swap: 5.2G, swap peak: 5.7G

[root@fedora ~]# systemctl status duplicati.service
● duplicati.service - Duplicati web-server
Loaded: loaded (/etc/systemd/system/duplicati.service; enabled; preset: disabled)
Drop-In: /usr/lib/systemd/system/service.d
└─10-timeout-abort.conf
Active: active (running) since Thu 2026-08-27 12:11:36 SAST; 4 days ago
Invocation: 1c55470bcc094223b5ec7b89519727b4
Main PID: 1587 (duplicati-serve)
Tasks: 20 (limit: 37914)
Memory: 221.2M (peak: 13.6G, swap: 5.2G, swap peak: 5.7G)
CPU: 4h 51min 53.092s
CGroup: /system.slice/duplicati.service
└─1587 /usr/bin/duplicati-server --webservice-port=8200 --webservice-interface=any

What info can I provide to help with improving this?

Thanks.

Is this typical for what you see? Is there a pattern to when the memory usage increases?

It is not something I have tried debugging this way, but some AI suggestions are:

awk '/^[0-9a-f]+-/ {hdr=$0} /^Swap:/ {if ($2 > 0) print $2 " KB  " hdr}' /proc/1587/smaps | sort -nr | head -n 15

(Change the PID if you have restarted since).

This should show if it is “anonymous” memory or related to SQLite or other file mapped memory operations.

If it is mostly anonymous, you can use the bundled dotnet-dump to inspect the memory:

dotnet-dump collect -p 1587
dotnet-dump analyze core_<timestamp>
# Inside the prompt, type: dumpheap -stat

If you can share the collected memory file, I can run the dotnet-dump analyze step and perhaps get close to figuring out where the memory is held.

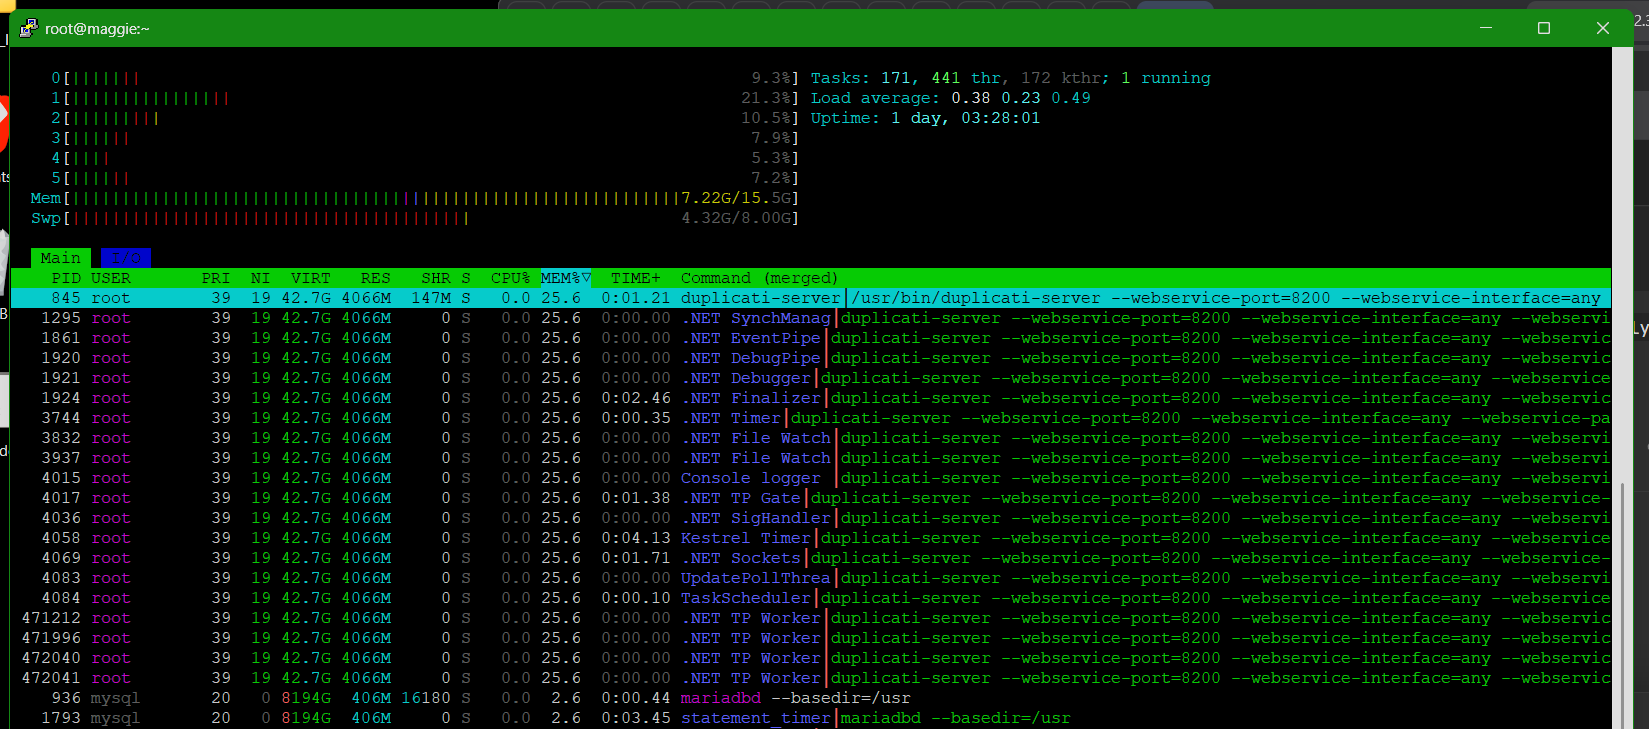
I’ve reported the same quite a few times, though I’m on Fedora 44 now it happens after about 3 or 4 days, so I just tried getting the info as I’m getting system alerts:

[root@maggie ~]# systemctl status duplicati.service
? duplicati.service - Duplicati web-server
     Loaded: loaded (/usr/lib/systemd/system/duplicati.service; enabled; preset: disabled)
    Drop-In: /usr/lib/systemd/system/service.d
             +-10-timeout-abort.conf
     Active: active (running) since Tue 2026-09-01 06:51:55 CEST; 1 day 3h ago
 Invocation: b6a002b1335047e1b4dc8b5f57daa532
   Main PID: 845 (duplicati-serve)
      Tasks: 18 (limit: 19024)
     Memory: 7.7G (peak: 10G, swap: 4G, swap peak: 4.4G)
        CPU: 1h 50min 32.214s
     CGroup: /system.slice/duplicati.service
             +-845 /usr/bin/duplicati-server --webservice-port=8200 --webservice-interface=any --webservice-password=

Sep 01 06:51:55 maggie.star-one.co.uk systemd[1]: Started duplicati.service - Duplicati web-server.
Sep 01 06:52:04 maggie.star-one.co.uk duplicati-server[845]: Server has started and is listening on *, port 8200
[root@maggie ~]# awk '/^[0-9a-f]+-/ {hdr=$0} /^Swap:/ {if ($2 > 0) print $2 " KB  " hdr}' /proc/845/smaps | sort -nr | head -n 15
131072 KB  7fd448000000-7fd450000000 rw-p 00000000 00:00 0
131072 KB  7fd440000000-7fd448000000 rw-p 00000000 00:00 0
131072 KB  7fd438000000-7fd440000000 rw-p 00000000 00:00 0
131072 KB  7fd430000000-7fd438000000 rw-p 00000000 00:00 0
131072 KB  7fd428000000-7fd430000000 rw-p 00000000 00:00 0
131072 KB  7fd420000000-7fd428000000 rw-p 00000000 00:00 0
131072 KB  7fd418000000-7fd420000000 rw-p 00000000 00:00 0
131064 KB  7fd410000000-7fd418000000 rw-p 00000000 00:00 0
130872 KB  7fd3f0000000-7fd3f8000000 rw-p 00000000 00:00 0
130864 KB  7fd398000000-7fd3a0000000 rw-p 00000000 00:00 0
130800 KB  7fd400000000-7fd408000000 rw-p 00000000 00:00 0
130596 KB  7fd3f8000000-7fd400000000 rw-p 00000000 00:00 0
130596 KB  7fd388000000-7fd390000000 rw-p 00000000 00:00 0
130524 KB  7fd3c8000000-7fd3d0000000 rw-p 00000000 00:00 0
130444 KB  7fd390000000-7fd398000000 rw-p 00000000 00:00 0
[root@maggie ~]# dotnet-dump collect -p 845
-bash: dotnet-dump: command not found

I’ll refrain from restarting for as long as I can, but I’ll have to do it eventually

The dotnet-dump is not configured for the whole system (few people will need it).
It should be in the folder where Duplicati is installed, like:

/opt/duplicati/dotnet-dump collect -p 845

I had restarted since posting, and now my usage is:
Memory: 968.9M (peak: 6.6G, swap: 880M, swap peak: 880M)
It will build up again, I’m sure, and then I’ll post the details.

It’s nowhere on the machine

Thanks. The details from @Taomyn shows that all the memory is in Duplicati (.NET) so there is no easy fix with SQLite or similar.

Arh, AI madness, I should have checked. The dotnet-dump is the tool on the developer machine.
You can get it like this:

curl -L https://aka.ms/dotnet-dump/linux-x64 -o dotnet-dump
chmod +x dotnet-dump

But you do not need it, Duplicati bundles a simpler tool called createdump:

/path/to/createdump -u -f /tmp/duplicati.dmp 845

In my check it did not look like it had the exec bit, so you may need to chmod +x it.

@kenkendk that’s better, found it, but had issues with disk space but once sorted the dump completed:

/usr/lib/duplicati/createdump -u -f /srv/nextcloud/tmp/duplicati.dmp 845
[createdump] Gathering state for process 845 duplicati-serve
[createdump] Writing full dump to file /srv/nextcloud/tmp/duplicati.dmp
[createdump] Written 9353322496 bytes (2283526 pages) to core file
[createdump] Target process is alive
[createdump] Dump successfully written in 25499ms

The file is 832MB in size as a RAR, 9GB uncompressed, so should I DM it to you?

FYI, my server seems to have calmed down now with RAM returning to normal and the swap clearing out. I didn’t do anything other than run the earlier commands to get the info. Perhaps it was simply performing something in the background that was taking over 8hrs, but there was nothing showing on the UI or logs.

Yes please. Upload it somewhere and then DM me the link.

I have no idea what would run for 8hrs, but I assume the dump contains the high load measurement.

I hope we will know more once I get to analyze the file.

Thanks!

I have now spent some time analyzing the memory dump collected by @Taomyn.

There are no easy wins as it appears all the memory has actually been released by .NET and “only” 133MB was referenced as .NET memory.

The rest of the memory is “unmanaged” meaning it is allocated by glibc but released by the .NET code.
Poking around it, it looks like it is mostly paths and hash strings created during the backup scanning process. I could be wrong as I cannot identify purely binary data, but it did not look like obvious text file contents even though many paths have an extension that indicates they are text files.

One AI suggestion is to attempt to reduce the amount of memory pools that glibc keeps around by setting the environment variable in the service file:

[Service]
Environment="MALLOC_ARENA_MAX=2"

This will make glibc only have 2 pools, so it is forced to release memory faster.
If you can try with this setting, maybe this will fix the issue.

A recent issue reported in the 2.4 release thread reminded me of this issue.

The issue is that during the delete of old filesets, the memory usage can grow significantly if there are many files in a fileset. There will be a fix for this in the next canary.