I set up a big backup, interrupted, restarted, and had profiling log stop as above,
which confirms one way to see if you’re in this. I “think” if you also set the option
  --profile-all-database-queries (Boolean): Activate logging of all
    database queries
    To improve performance of the backups, frequent database queries are
    not logged by default. Enable this option to log all database
    queries, and remember to set either --console-log-level=Profiling or
    --log-file-log-level=Profiling to report the additional log data
    * default value: false
then you’ll get the more expected case of the big query starting but not finishing.
Windows users have other options, even with Microsoft installable programs like
Sysinternals Process Explorer where you find busy thread and then check stack:
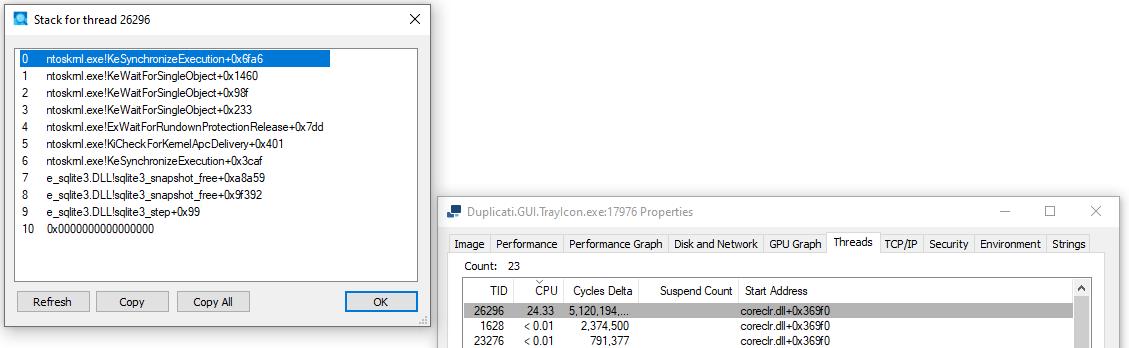
If you see sqlite on the stack, very CPU busy, it’s probably busy in slow query.
I let my “Completing previous backup” run about 19 hours before killing Duplicati.
Before killing, I tried GUI Stop button (showed Abort), Abort, and a TrayIcon Quit.
Release: 2.3.0.102 (Canary) 2026-05-09
Slow Query Monitor
Added a slow query monitor to help diagnose performance issues by tracking long-running database queries.
Synthetic Filelist Optimization
Optimized the creation of synthetic filelists, improving performance for large datasets.
If anyone decides to test this, remember that Canary releases are test releases.
Eventually the change will presumably somehow get into better-proven release.
Maybe the developers will post more news when more is known about situation.