I agree, that is what the synthetic file list is there for: best effort backup when things fail.
I think you are right, this is a newer issue, but so far we have not been able to reproduce it. We have multiple tests that try various failure scenarios to make sure we cover this, but all of them pass.
I agree with that: first step is figuring out if it is stuck in SQLite land, or in C# land. Based on the profiling log provided by @sgeklor it does not look like any SQL query has started, as it would usually be written with a “Starting - xyz” line, and we see the other queries do that.
That indicates that it is not in SQLite, but instead in some loop that just never exits, which is harder to find .
There is a commandline tool called createdump included in the Duplicati installations (all OS’es). It is not symlinked so you need to supply the full path to your Duplicati installation, but then you can get it to dump the current state, something like:
/usr/share/Duplicati/createdump --stackonly <pid>
The --stackonly is important as it then only captures the stacks and not any memory that is both large and may contain secrets. Remember that Duplicati needs to be in the stuck state when running the command.
The output file will be at /tmp/coredump.<pid>. If you can share that file with me (send me a PM), then I can figure out where it gets stuck and hopefully correct it soon.
I’m happy to provide the debug info. I just don’t know exactly when I’ll get to it as I’ll need to slot it in around other work and travel requirements. Will do my best.
PS: Maybe it’s related to the size of my backup set?
The issue has a wiff of a C# operation carrying away, either a sort or inefficient lookup routine. Such a thing can easily finish quickly with small back up sets but falls over (stuck operation, no log, single thread CPU at 100%, etc…all matching what I observe) for a large backup set.
In case it helps, my numbers are: source # files 2.5 M, source size 2.7 TB, database size 4-5 GB, block size 5 MB, no idea how many blocks are in the database.
Actually, after some debugging on this issue, I have discovered that there are many (100+) SQL queries that are not logged. This happens because the APIs are very similar, so it looks correct and works, but calls the database directly instead of reaching the logging.
So I am back at thinking this is indeed an SQL query that performs poorly, and it is perhaps caused by the upgrade to the SQLite connection which is otherwise faster.
More debugging, and I believe I found the offending query:
It turns out that the query WAS in fact using logging, but was incorrectly disabled behind the flag --profile-all-database-queries which is default false to avoid time consuming log operations inside the backup flow.
I will merge the new query and get a canary out that has the fix so we can test if it works as expected.
I set up a big backup, interrupted, restarted, and had profiling log stop as above,
which confirms one way to see if you’re in this. I “think” if you also set the option
  --profile-all-database-queries (Boolean): Activate logging of all
    database queries
    To improve performance of the backups, frequent database queries are
    not logged by default. Enable this option to log all database
    queries, and remember to set either --console-log-level=Profiling or
    --log-file-log-level=Profiling to report the additional log data
    * default value: false
then you’ll get the more expected case of the big query starting but not finishing.
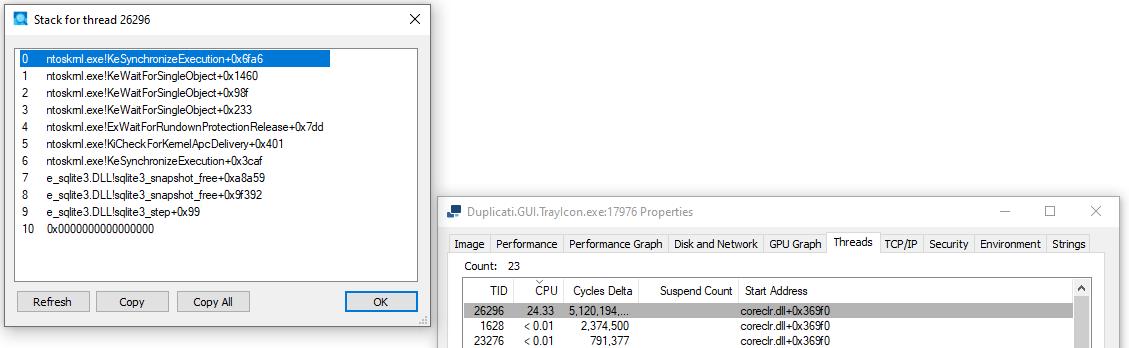
Windows users have other options, even with Microsoft installable programs like Sysinternals Process Explorer where you find busy thread and then check stack:
If you see sqlite on the stack, very CPU busy, it’s probably busy in slow query.
I let my “Completing previous backup” run about 19 hours before killing Duplicati.
Before killing, I tried GUI Stop button (showed Abort), Abort, and a TrayIcon Quit.
Added a slow query monitor to help diagnose performance issues by tracking long-running database queries.
Synthetic Filelist Optimization
Optimized the creation of synthetic filelists, improving performance for large datasets.
If anyone decides to test this, remember that Canary releases are test releases.
Eventually the change will presumably somehow get into better-proven release.
Maybe the developers will post more news when more is known about situation.
To add, using also version 2.3.0.1 on Debian 11. Same “Completing previous backup” where enabling the “disable-synthetic-filelist” setting did the trick. Thanks all!
 .
.