I recently started using Duplicati and initially tested it with AWS before switching to Backblaze B2. I’m running the latest stable version with default settings, including a volume size of 50 MB.
At first, everything worked smoothly: I achieved an upload speed of around 3 MB/s, which aligns with my 30 Mbit/s connection. However, as the backup progressed, the speed gradually dropped to just 800 KB/s, even though there are still 1.3 TB left to upload.
To rule out a connection issue, I tested a manual upload via Backblaze’s web interface and still achieved 2.3 MB/s, which would be acceptable for me.
I’ve read in older forum posts that compression could be the cause of slower speeds. However, my CPU usage remains low, so I’m not sure if that’s the issue in my case. Do you have any suggestions on how to restore my upload speed?
Although it’s not human-friendly, you can watch uploading status in About → System info.
lastPgEvent has stats like the below, and the calculated speed there should match status:
“BackendFileSize”:20820762,“BackendFileProgress”:6082560,“BackendSpeed”:2019094,
When Progress catches up with size, there’s nothing to do, so speed sags until an upload.
If on the other hand, this is an initial backup, then there are other factors to worry about…
The number inside Duplicati is not transfer speed. The speed shown in the UI is processing speed, meaning how many bytes of source files are processed per second.
If something slows down the processing, this number will drop. The uploads may very well continue at the full line speed.
Could it be that the files that are being read are “special” and this slows everything down? If you attempt to back up files from a remote share or the OneDrive folder, this can significantly slow things down, as each file access will cause network traffic.
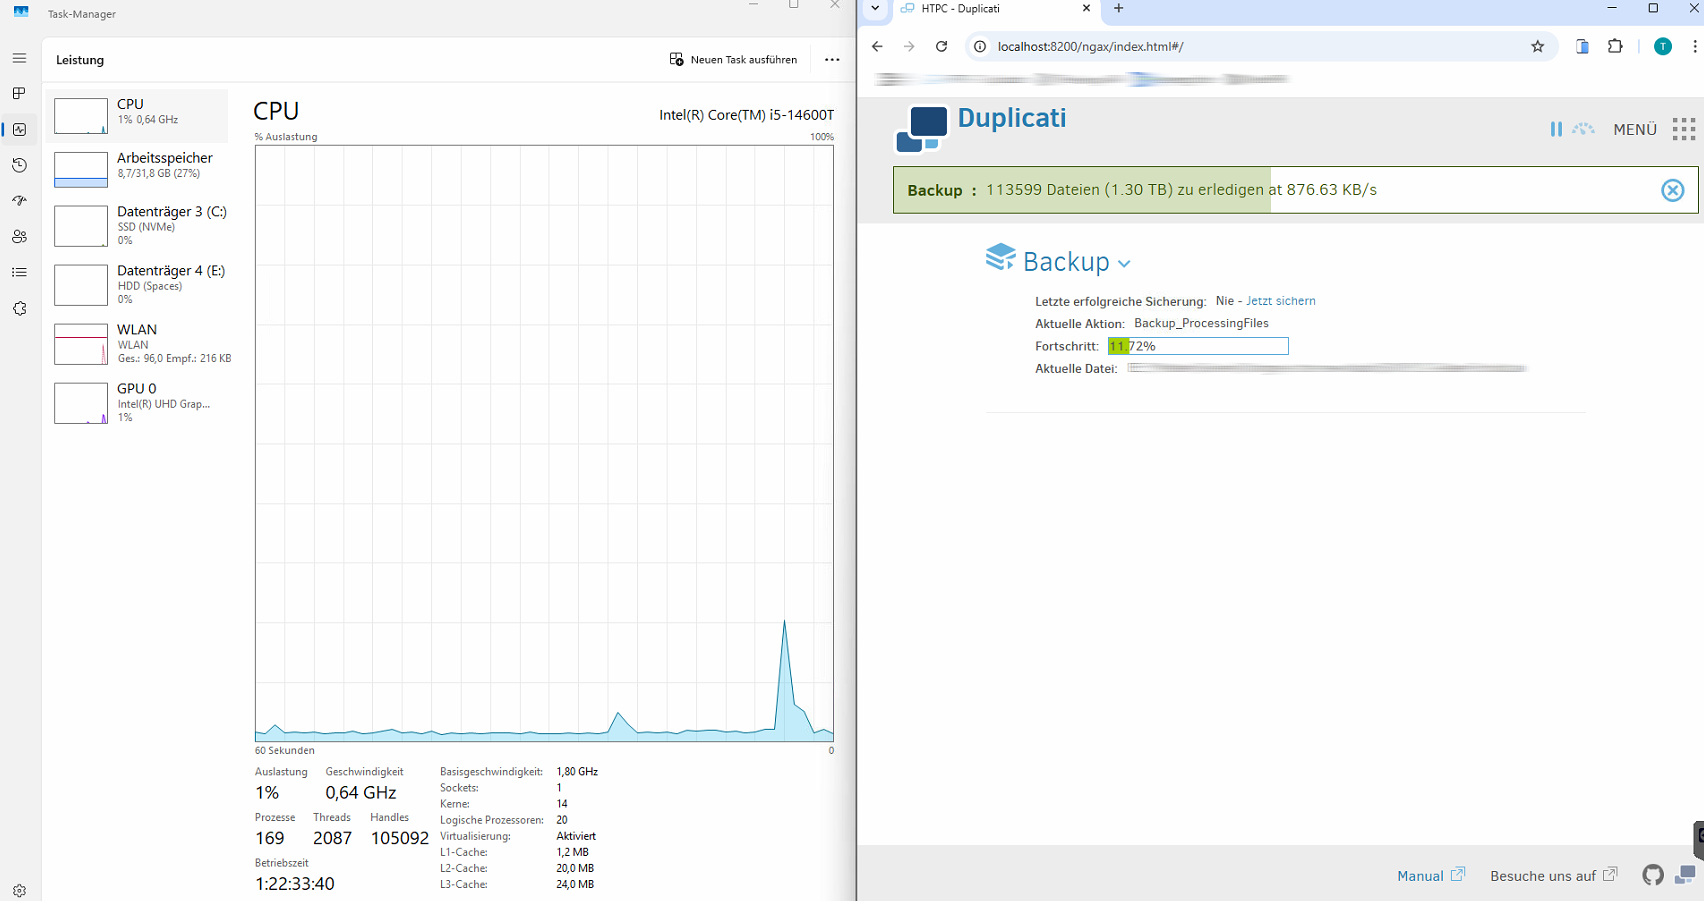
The screenshot you provide show a fairly lightly loaded system, so I am thinking that some kind of (network-) waiting is causing the slowdown.
@tms as you can tell from the discussion, there are several different numbers in the status.
IMO (until I learn otherwise) you’re talking about (rounding) the at 876,63 KB/s.
This is average upload speed I was talking about, which gets occasional uploads.
The 1.3 TB “left to upload” is more like “left to process, to see what has changed”.
Duplicati uploads changes. This saves a lot of space and a lot of need for upload.
A Duplicati version is not a copy of all its files. Smaller uploads are a “good thing”.
If on the other hand, that 1.30 TB is not going down, there may be a source issue.
Yes, that part is derived from the transfer progress of the backend, so a drop here could indicate network slowdown. But, it is a bit odd when having multiple transfers as they may interfere because there is only one progress value and multiple transfers.
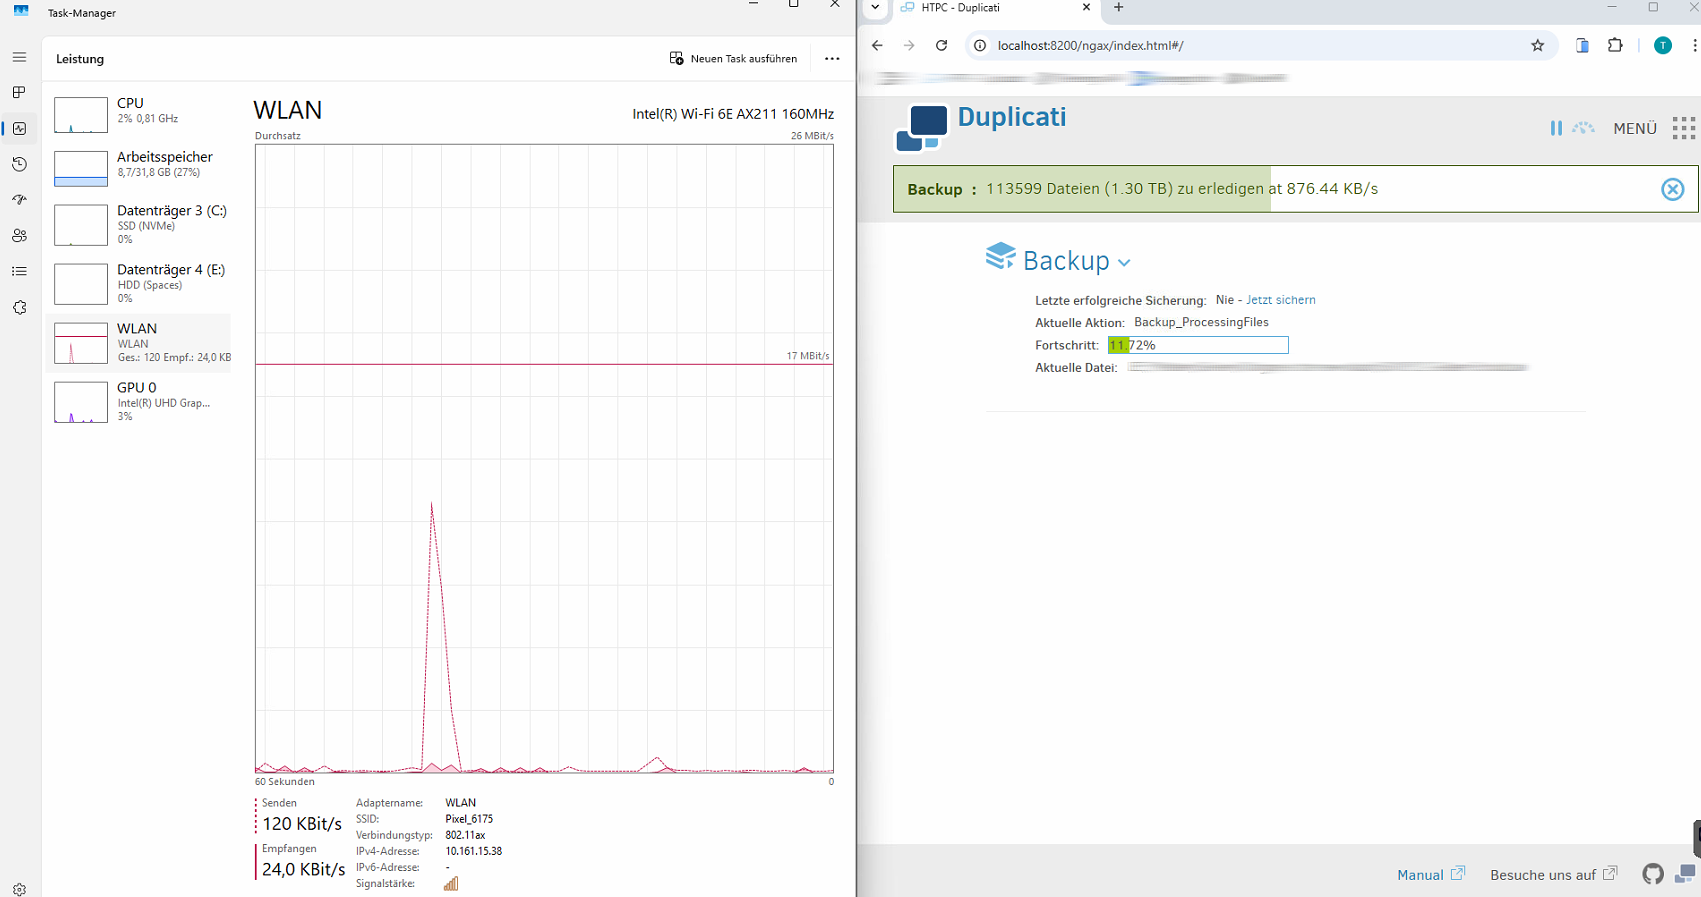
I would not trust it fully in determining the actual transfer rate. Looking at the second screen, it actually shows 17Mbit/s, or just over 2 MB/s, which seems to be close to the expected rate.
In other words, is this a case of a UI that shows an incorrect speed, but the transfer is actually fat enough?
Sorry, but where is the second screen? There seem to be two images in original post.
First has CPU on the left, second has WLAN. Both have other values. Where is a 17?
The right screens on the two images are disturbingly similar in progress through a file.
Neither has time, but status on first has 876.63 KB/sec, and second has 876.44. Sag?
Distinguishing between source reading stalls and destination writing stalls can be hard.
About → System info statistics might show, but we don’t have any of those to look over.
I’d hope that BackendFileSize and BackendFileProgress are across all uploaders, so not far off.
Not just network slowdown, but lack of any remote volume ready to upload. Average sags, right?
The second one with WLAN, it has a line with “17Mbit/s” written above it. Looking again, that may be the peak line speed. The speeds shown at the bottom does not appear close to the 876 KB/s.
Sadly not. The reporting was done before parallel uploads were introduced. Each starting transfer will reset the progress and start time, but any transfer may update it :'(.
Yes, if there is nothing to transfer, it will of course not transfer. But that would not explain why the overall progress is not moving (assuming it is stuck based on OP).