Unexpected difference in fileset (why must the topic be unique)

Then seemingly this recreate did not download all the dblock files. If you really want to, you could sort alphabetically, select just the dlist and dblock, and see if that matches what was downloaded.

The externally visible numbering (such as on Restore dropdown) is 0 for latest, then going up as older backups are found, so I’m not sure why there is a gap. A possible explanation is that some backup got interrupted, left a partial backup that did not have whatever was broken, so didn’t list. Looking at the Restore dropdown would spot which backups are partial, as would DB bug report.

The LogData table is in the database. Maybe it was requested, knowing you have a DB browser.

Example:

image

Example of a Fileset table, including the column that says whether a version holds a full backup:

image

The backup ID is the job number. You can see it in the URL if, for example, you Edit some job.

UPDATE!

After deleting the recommended dbindex file the Recreate has completed with 1 warning…

2024-04-03 22:50:22 -07 - [Warning-Duplicati.Library.Main.Database.LocalRecreateDatabase-MismatchInBlocklistHashCount]: Mismatching number of blocklist hashes detected on blockset 17648. Expected 0 blocklist hashes, but found 1

I do not know what that means. But I am presuming it is referring to the dbindex file I removed?

Are you asking me for information? I can try and open that file with my database app and retrieve it.

When I peeked at the source, it looked almost like the destination had a slightly broken dlist file. Possibly we can get a more expert opinion on that. A database bug report would also help, but it reportedly can take awhile on large backups, so I’m not sure exactly what to suggest to get one…

I wasn’t, but you’re working with two people here. What I’m interested in is what happened before the problem, and that’s off the bottom of your screenshot. What you did show is interesting, since database id 767 shows the first problem reported by Beta, yet multi-testing Canary started at 768.

For me, what happened on Mar 4 in the job log, or (e.g. from error) About → Show log → Stored?

For the @kenkendk version 42 question, I don’t know if it it’s still for 42, but if you want to go into database, my explanation might make more sense while following my database images. I think 42 would be in Fileset ID column. To its right is OperationID (Operation table if you get curious) which is the second column in LogData. The raw unformatted Message is to the right, but really I think if you’re able to view this database too, just go look for the right regular job file for a “Complete log”.

I would like to remind you that I have isolated this to a workshop machine. Even when I have this back in production with the client I can still run stuff on this workshop machine. So I can take a few days to run bug report… however you all are going to have to tell me exactly what to do.

FYI: I had installed the current Canary on the clients computer during this process. The computer running the backup now is on the most current BETA and not Canary.

Okay… so I setup the DB app you recommended and opened the Database file for the backup PRIOR to the rebuild. This is the one directly after getting it from the originating workstation…

I feel like the info I am being asked for may not be there, ORRR I am looking in the wrong place…

For me, there are two places to look. The server log is in the Duplicati-server.sqlite database, and on a Windows system probably has to be viewed with Duplicati and About → Show log → Stored.

was a nice start, but what’s before that? For job log, it’d be easier also to look for the March 4 log in the usual spot, and it will be formatted better, and complete. The LogData has the same log in the Message column, and if you pick one, you can copy and paste, but it will still be hard to read.

You need the Fileset table too to figure out what kenkendk wanted, but for me, let me see if I can figure out from the Timestamps which one is March 4, but you can probably type 2024-03-04 in the Filter box above the Message data and get there before me (assuming a log for then exists).

I tried to open that first but it says it is not a valid database. ??

Nothing… that is all of it.

Zero results in the LogData table.

Fileset has nothing under the 700’s unless you are talking about the literal row number…
Screenshot

It’s weakly encrypted at DB level to add protection for secrets like SFTP credentials.
This is on by default for Windows, which is why I said you’d probably need Duplicati.

With the age of this backup, I don’t know how it could possibly have been first error.
Job logs do get purged after a default 30 days, but I don’t know if server log purges.
If that was it, then we just missed the window by a couple of days. What’s strange is
the first job log in your image looks like January 31, and there are unexpected gaps.

You can get there with the row number if you click on ID to sort descending, so top line is numbered row 1. You might think that version 42 is line 42, but as Duplicati versions start with 0 rather than 1 as database rows do, version 42 is database row 43 (assuming I did math right…).

Another way to see what 42 is to to look at OP, assuming the database backups are the same.

Does it have in the 700s, specifically 769 in ID? If so, look at OperationID one column to its right. That number would (I think) be the OperationID in LogData, but potential age-delete worries me.

Let’s try it another way. This is clearly thinking about the job log, so maybe Filter Messages on

connection attempt

and if it’s not there, it’s not there. Thanks for your patience in trying to get through all this stuff. Getting job logs even from a database bug report is often impossible because they get erased generously in the report, if things like paths (for example) get logged, and this does happen…

Can you say the date and time from the log? The first report is sometimes not when problem actually got inserted, which is why I’m still looking for history on that day, and leading up to it.

That’s a shame. Failure was reported March 5, and to me at least, some history is still important. Depending on how much has happened since (maybe not much, given the error), there’s often a view in file operations that can yield some clues. A possibly human-friendly way is to use GUI in <job> → Show log → Remote and hope that “Load older data” doesn’t have to be run too much.

I think this comes right from the RemoteOperation table, where you can guess where you are by looking at dates on the dlist files. A DB bug report would have that whole table, but I’m wondering how long it would take on your big backup. If you got any broken small ones (I lost track), we can try an analysis on one of them, since the one we’re in is also not giving me the log I’m wishing for.

If you’d rather focus on the larger backup, one way to get the RemoteOperation table without any searching around might be to use Export Table(s) as CSV file, then zip it and post it, or a link to it.

LogData might also be interesting, but there could be path names in there, so maybe review first.

Operation table should be safe from a privacy point of view. These will give a general sense of it.

This is sort of trickling the data out rather than seeing how long a bug report will take, but if you’d rather see how long a full bug report takes, feel free. It might be best starting with the original DB taken from the client site, so there won’t be extra things done later, including accidental removals.

If it seems to take too long, the usual steps of peeking at About → Show log → Live → Profiling is helpful to find out why. System performance tools can help too. If you don’t want to tie up the GUI, The CREATE-REPORT command can be used, and I “think” the storage URL can be a fake thing, because what it really needs is likely --dbpath= pointing to wherever that database is available…

Upside of CLI is it’s independent, so doesn’t hog GUI. Downside is there’s not a live log available.

Another way to get an idea of history is to look at file dates, using some format that sorts nicely.

Example run on a shell:

$  ls -lnrt --full-time
total 12
-rw-r--r-- 1 0 0 695 2024-02-01 18:19:56.927034624 -0500 duplicati-b0a97967424324ec8a57587e95416bed0.dblock.zip
-rw-r--r-- 1 0 0 606 2024-02-01 18:19:56.971034625 -0500 duplicati-if061063496bc47c1b51c9dec6a8c40f4.dindex.zip
-rw-r--r-- 1 0 0 650 2024-02-01 18:19:56.987034625 -0500 duplicati-20240201T231955Z.dlist.zip

or if the above is too revealing, you can do it a different way which doesn’t sort, but sort is easy:

$ find . -type f -printf "%T+ %P\n"
2024-02-01+18:19:56.9270346240 duplicati-b0a97967424324ec8a57587e95416bed0.dblock.zip
2024-02-01+18:19:56.9710346250 duplicati-if061063496bc47c1b51c9dec6a8c40f4.dindex.zip
2024-02-01+18:19:56.9870346250 duplicati-20240201T231955Z.dlist.zip

That is the information I was asking for. The table is sorted oldest-first and I am most interested in the latest runs. Can you make a screenshot where you sort descending on the ID ?

I am looking for a sequence like this (last operation first):

  • Repair
  • Repair
  • Failure
  • Failure
  • Backup
  • Backup

So the backup was running, then it failed, and then some fixes were attempted.
I would like to get the content of the log file for the last valid backup and the first failure, because that will allow me to get closer to where the issue arises.

The string is JSON and may contain filenames that are sensitive. I do not need the filenames, but would like the rest of those two messages. Feel free to send the via PM to me.

There is an issue with the current updater where it detects changes in the update and rolls back. Makes it really difficult to diagnose. The feature is removed in the new version that I am working on.

That is good news. So the issue seems to be that the cleanup marks some files for deletion, but for some reason never deletes the dindex files (code error, crash, network, etc) and this breaks the recreate.

If the backup is otherwise correct, it is safe for the code to simply mark these files for deletion. Since they are dindex files they only exist to speed up the database recreate and can be deleted with no data loss.

The warning indicates that there is still a dangling piece of information somewhere.

I think we’re asking for some of the same things, but with different delivery options (which may help things).

To clarify, I guess this is the Operation table.

I guess this is LogData table, with log JSON in Message, and maybe some fishing by date, however prior fishing attempt in Message didn’t find what was sought. Might need manual looking at Message for nearby dates actually available. If just export-all or selective copy/paste and PM works, that’d help. Just need info

Presumably in a dlist file. I can get these if I mangle one by shortening the length and leaving the blocklist, however it makes a noisy error for, e.g. shortening 1025 to 1024. If I edit length down to 0, it’s just a warning. One thought that crossed my mind was whether inconsistency might result from possible non-atomic work.

I was looking at the screenshot of LogData.
You can see the lines starting with “MainOperation” are not backups, the others are (most likely) backups.

You can go via the Operations table for full confirmation.

Do you mean that you manually edit the dlist file?

If so, then I agree it is probably a dlist file that should have been deleted.

Yes. That seemed to be (per source) what the message is looking at. Here’s the last filelist.json:

[{“type”:“File”,“path”:“C:\backup source\1025.txt”,“hash”:“47DEQpj8HBSa+/TImW+5JCeuQeRkm5NMpJWZG3hSuFU=”,“size”:0,“time”:“20220331T223022Z”,“metahash”:“FoR5ceV786zErB7j9BJLvfqnkci8K/Z3GDtGsthjkwg=”,“metasize”:137,“blocklists”:[“8M8kl63PDKtXA4G8kibQ1JrvOUrG2BMzoD8VdYAkXjU=”]}]

but (at least with this little test), I didn’t find anything in the recreated database that clearly would sucker Duplicati into deleting a row of the FileLookup table, e.g. if BlocklistHash table actually held bogus entry.

EDIT:

If I change 0 to 1, it escapes the special case for 0, and looks more like 1024 was doing. Noisy error is:

As this is the Canary release, the job log is more likely to be there, but noisy popup is in old too I believe.

OK, drawing inferences about the operations. I was looking at the Timestamp fields, and am concerned by

Isn’t that a jump from Mar 1 to Mar 27 in logs? This version skips job logs when things go wrong. That was the motivation for trying the server log. The Operation table seems consistently there, but lacks the details.

Maybe it’s time to dip a toe in the external log waters to get at least summary info without rollback etc. loss. That could be something hardcoded into Duplicati eventually, but here it’s user and Advanced options, e.g. log-file=<path> log-file-log-level=retry (for starters in case network issues such as were seen are involved).

EDIT 1:

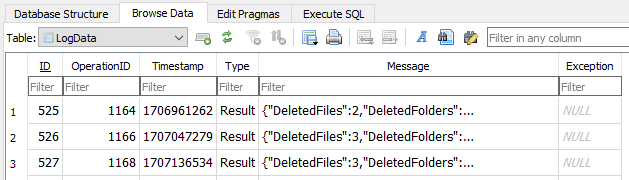
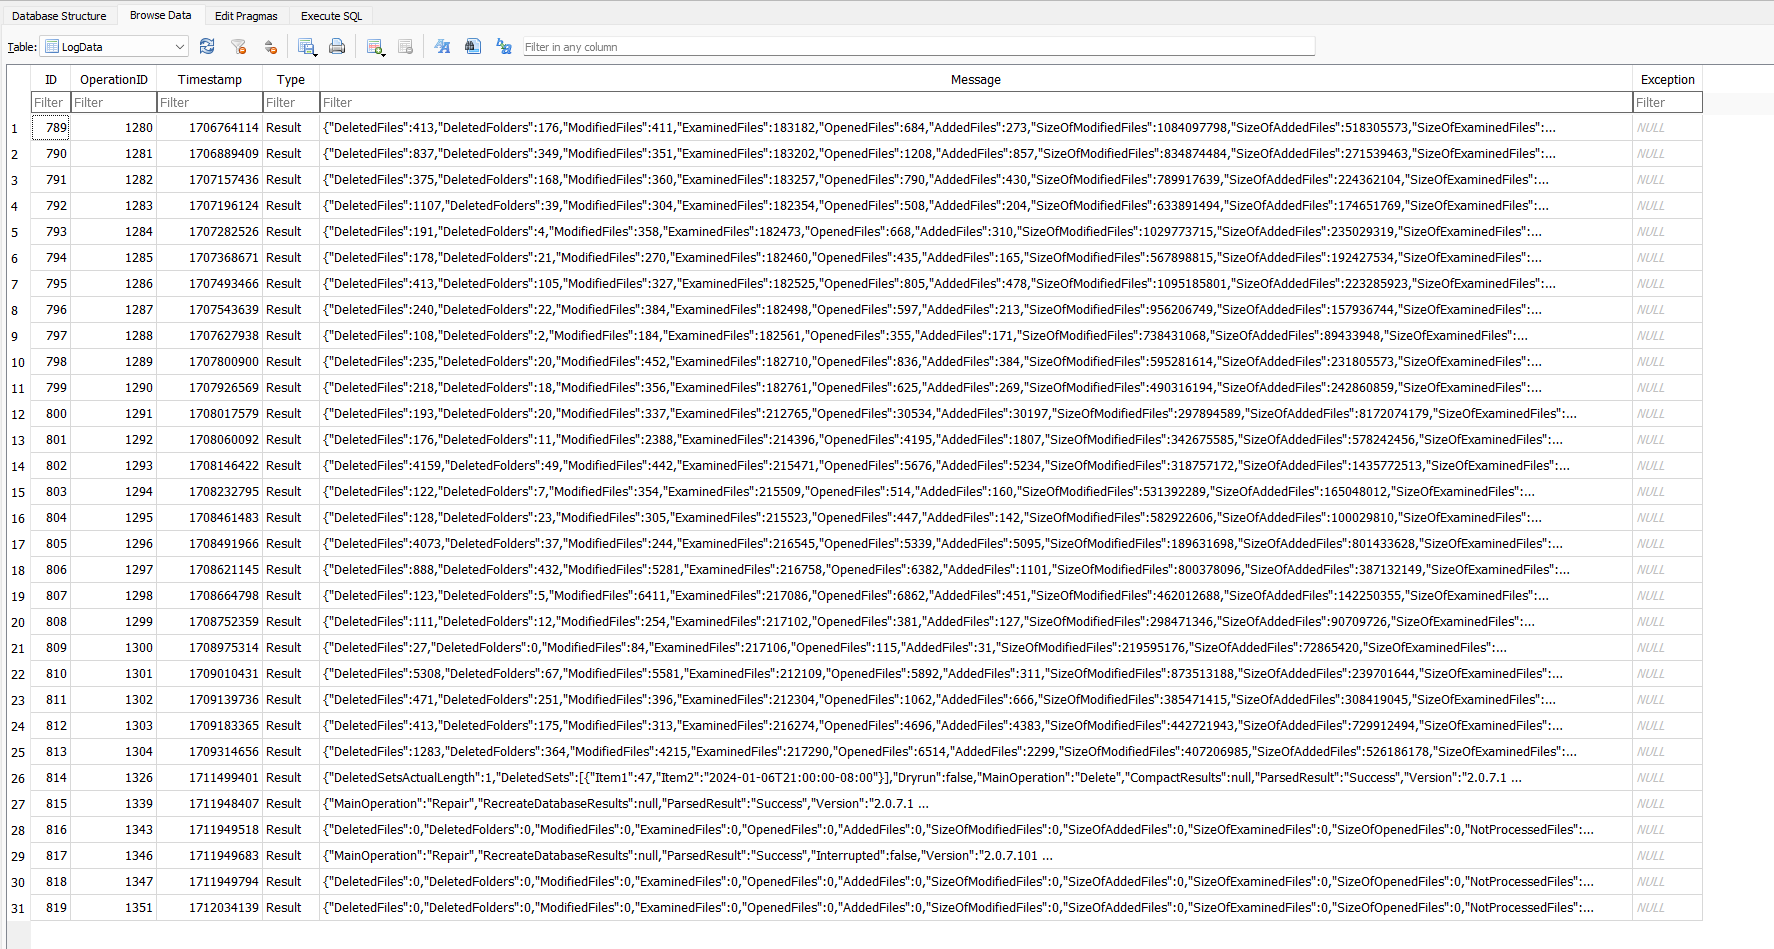
March 27 looks like a Delete, based on DeletedSetsActualLength code (plus the rest of the visible log line).
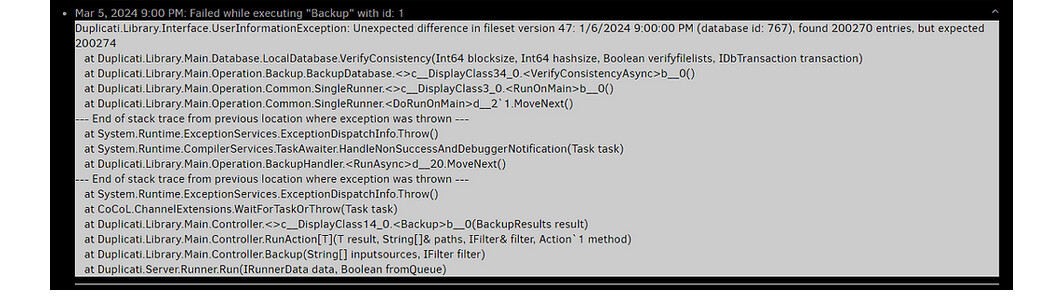
Server log image was posted above and shows several of the failed backups during the gap in the job logs.
I’m not sure that the job logs we want exist, but it hasn’t been 100% proven. There are also the other logs I mentioned, and the files on the destination itself, though that info gets stale as files there change with time.

EDIT 2:

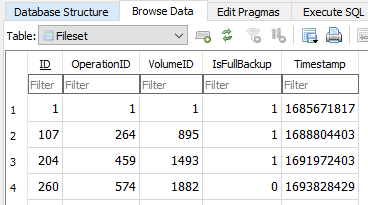
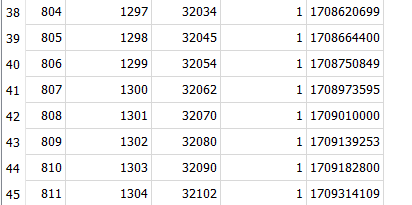
There might be part of that, as OperationID 1304 might be the last valid backup. My prior thought from the server log that March 5 was the first error might be wrong, as default log-retention is 30 days, and no prior server log entries were found. The explanation for why there is a January 31 job log around in the image is (roughly anyway) explainable by its PurgeLogData only running after good backup occurs. Those stopped.

So first failure might have made no job log, because it didn’t in this Beta, and maybe server log aged away. PurgeLogData for the job log also cleans up Remoteoperation table, so we might have that back to Jan 31, assuming we can get anything sent to us somehow, e.g. by Export, or database bug report (possibly slow).

Meanwhile, a copy-and-paste of the Message JSON for OperationID 1304 in LogData would be a nice start.

EDIT 3:

Although it will probably erase some of the job logs for privacy, the database bug report might be runnable in a reasonable amount of time. I tried a 700 GB backup (but with 1 MB blocksize) of roughly 1 million files, and creating the report takes about 50 minutes, with 25 being a VACUUM at the end – added in Canary for better sanitization. Backup is on a portable USB drive, and system itself has a 7200 RPM hard drive that gets busy.

On system with SSD and likely faster processor, their speeds might offset the presumably bigger database (mine is about 3 GB). Compressed bugreport is about 1 GB, but now I’m also worrying about .zip size limit.