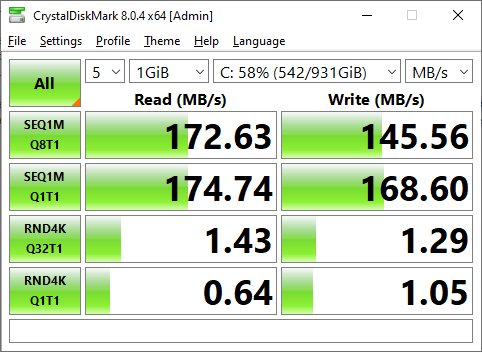
Mechanical drives are far better at sequential than random, and Duplicati performance that has some involved is probably somewhere in between. Below is the computer I’m on. Note the huge differences.

Probably host e.g. Task Manager and Resource Monitor, and maybe mostly disk but you’d have to look.
The target probably has an easier time (if it’s disk limited) because it’s sequential writes, and you have seemingly measured that already. The source system scans for changed source files by examining file timestamps, then changed files must be read to find the changed blocks, which then go into a .zip file created in the user’s Temp folder. Actions are recorded in a database typically in user profile. When file reaches configured remote volume size, it is encrypted and copied out. All this disk activity is in parallel.
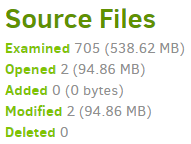
See backup logs for statistics on what there is, and what was modified (which gets a file read-through):

Your database location is on the Database screen, but is probably in the user profile, as Temp might be. tempdir option can move the folder Duplicati uses for temporary files. For source, I guess it’s where it is however because this is Windows you can use usn-policy to use the NTFS journal to avoid full search. Doing so requires an Administrator account with elevation in effect (e.g. a UAC prompt). SYSTEM will of course work (and doesn’t prompt you), but typically needs setting up Duplicati as a service (extra steps).
If somehow Duplicati is bogged down on its SMB transfer (not my first guess), you can backup to a local folder to see how fast that goes. Is this the initial backup or a later one? Initial backup disk use is probably mostly affected by block processing and not by searching for changes because everything needs backup.
I’m picking on the drive because in my Task Manager I often see it fully utilized and below 8 mbits/second.
I’m not sure of the exact algorithm that produces status bar speed. Bursty speed should be visible in Task Manager on a network interface (assuming it’s not drowned out by other network activities). One can also see transfer speed very clearly in logs at Profiling level. This run is upload speed limited. Yours likely isn’t.
2021-05-14 13:43:04 -04 - [Profiling-Duplicati.Library.Main.Operation.Backup.BackendUploader-UploadSpeed]: Uploaded 49.97 MB in 00:01:43.3480785, 495.14 KB/s
Profiling logs are huge. For just speeds, you can use log-file with log-file-log-filter and not log-file-log-level.
Getting a rougher idea of upload speeds can be done at Information or Retry level, even in About → Show log → Live. It will be a little confusing because there are parallel uploads to try to more fully fill the network.
  --asynchronous-concurrent-upload-limit (Integer): The number of concurrent
    uploads allowed
    When performing asynchronous uploads, the maximum number of concurrent
    uploads allowed. Set to zero to disable the limit.
    * default value: 4
If you cut that to 1 it should start looking sequential, with a dblock going out (default 50 MB) then its dindex.
There is a race between production of volumes to upload, and upload rate, If you want to view your Temp folder you can see things either backing up there (if production is faster than upload) or looking a bit empty.

