Introduction
During the benchmarking of Duplicati under different parameter configurations, one particular step in the process took up a considerable amount of time (20 minutes out of the 65 minute total runtime). This blog post describes the identification of the problem, the solution, and the resulting impact. The solution has been merged in the pull request #5595.
TL;DR
Two LINQ queries were the culprits. By changing the underlying data structure of the two LINQ queries from List<string> to HashSet<string>, they were sped up by up to 4 orders of magnitude, essentially removing their impact - the total runtime for backing up the particular dataset went from 55 minutes to 42 minutes.
Machine and Setup
All of the plots and data shown here are performed on the MacBook specified in the following table. All of the benchmarks were run with dotnet run -c Release. Other things were running on the machine during the benchmarks, but the machine was not under heavy load, so the results should be valid. The folder being backed up has 3449 files, 677 folders totaling 68 GB, amongst which there are duplicates. The remote storage is a workstation on a 10 GbE local network over SSH to a RAID 5 array of 8 HDDs.
The following table shows the different machines mentioned:
| Machine | CPU | RAM | OS | .NET |
|---|---|---|---|---|
| MacBook Pro 2021 | (ARM64) M1 Max 10-core (8P+2E) 3.2 GHz | 64 GB LPDDR5-6400 ~400 GB/s | macOS Sonoma 14.6.1 | 8.0.101 |
| AMD 7975WX | (x86_64) 32-core 4.0 GHz (5.3) | 512 GB DDR5-4800 8-channel ~300 GB/s | Ubuntu 24.04 LTS | 8.0.110 |
| AMD 1950X | (x86_64) 16-core 3.4 GHz (4.0) | 128 GB DDR4-3200 4-channel ~200 GB/s | Ubuntu 22.04 LTS | 8.0.110 |
| Intel W5-2445 | (x86_64) 10-core 3.1 GHz (4.6) | 128 GB DDR5-4800 4-channel ~150 GB/s | Ubuntu 22.04 LTS | 8.0.110 |
| Intel i7-4770k | (x86_64) 4-core 3.5 GHz (3.9) | 16 GB DDR3-1600 2-channel ~25 GB/s | Windows 10 x64 | 8.0.403 |
Identification
I was stress testing Duplicati to identify performance issues that I could tackle as part of my quest to speed up Duplicati.
One such issue that is known is that for small block sizes, identifying whether a data block has been seen before can take up a considerable amount of time due to the local database increasing in size.
As such, I was trying to perform a backup under different parameter configurations, in particular with small block sizes.
As I was tuning the --dblock-size (size of volumes) parameter, I noticed an extreme slowdown:
dblock-size |
Runtime | Relatively slower |
|---|---|---|
| 50 MB | 4:23.096 |
1.000x |
| 5 MB | 4:27.627 |
1.017x |
| 1 MB | 55:16.227 |
12.604x |
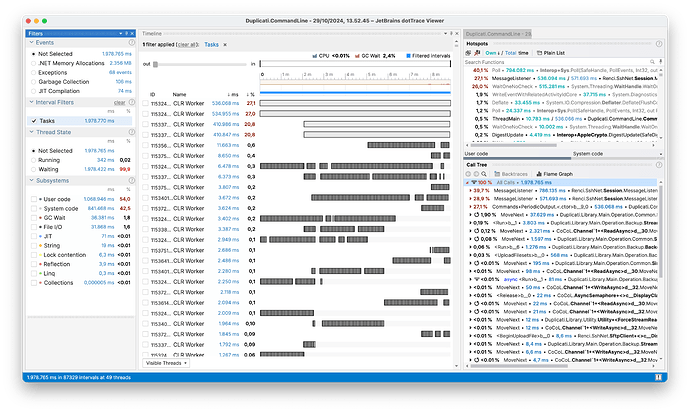
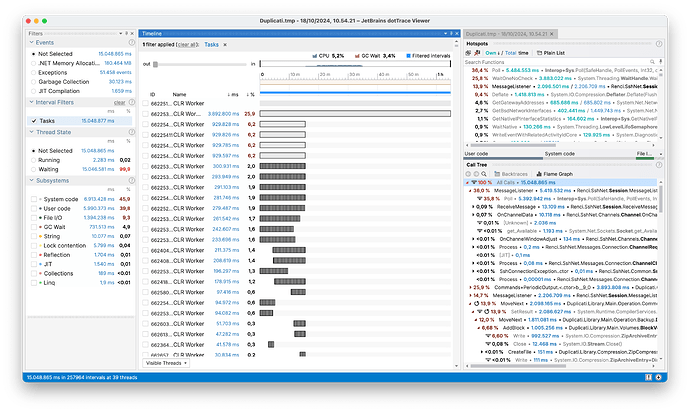
Wow, more than 10 times slower, that seems excessive. Let’s dive further by profiling the exact same call with --dblock-size 50m and 1m:
The first thing we notice is that it looks like the same type of workload shown in the 50m profiling is the same as the first 3rd of the 1 profiling. Thus, it looks like the 1m is doing something more. Diving further, we found that the issue was that due to --dblock-size and --blocksize being equivalent, the backup run would perform a compact every time, due to the sizes always matching up. While the triggering of the compact was unintended, it pointed out a performance issue in the compacting process.
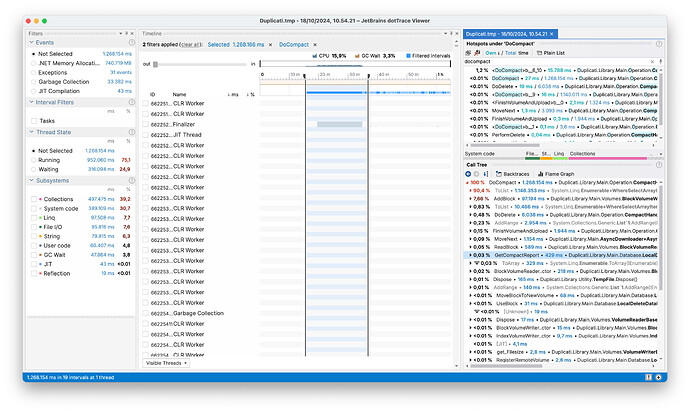
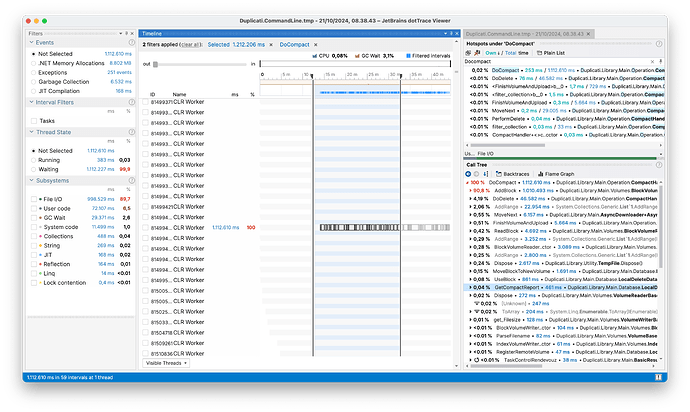
Looking at the console output, we see that it stalls right after processing all of the blocks, and before performing the download, check and delete steps. This indicates that the issue is in the preliminary steps of the compacting process. Zooming into that part of the profiling highlights the issue:
Here we see that the majority of the time spent is spent on LINQ and Collections operations: 90.4 % in the bottom right corner spent in ToList(). If we look into the code, we see that the two LINQ queries (Duplicati.Library.Main.Operation.CompactHandler.cs:131 lines 131-133,144-146):
var fullyDeleteable = (from v in remoteList
                       where report.DeleteableVolumes.Contains(v.Name)
                       select (IRemoteVolume)v).ToList();

...

    var volumesToDownload = (from v in remoteList
                            where report.CompactableVolumes.Contains(v.Name)
                            select (IRemoteVolume)v).ToList();
Timing the two queries using Stopwatch cements the issue: the two queries takes a combined ~15 minutes to perform.
Solution
The issue with both of these queries is that they compare two List<string>, which means that the select will take n elements and perform the Contains operation, which is also O(n). This results in each of the two queries being O(n^2), which is not ideal.
To address this issue, we tested several potential solutions:
- Compositional LINQ Methods: Convert the query to use compositional LINQ methods, which may allow the LINQ engine to optimize better.
- LINQ
IntersectMethod: Use the LINQIntersectmethod, which is designed for this type of operation and may be optimized by the LINQ engine. - HashSet for Faster Lookups: Change the underlying data structure of one of the
List<string>to aHashSet<string>, which has O(1) lookup time. Assuming theHashSet<string>can be built in O(n), this would make each query O(n) instead of O(n^2), resulting in a total of O(n+n) = O(n). - FrozenSet for Even Faster Lookups: Convert the
HashSet<string>to aFrozenSet, leveraging immutability for potentially faster lookups. - Parallel LINQ (PLINQ) with
Intersect: Use PLINQ to parallelize the query, which may benefit particularly large lists. - PLINQ with HashSet: Use PLINQ to parallelize the query with a
HashSet<string>. - PLINQ with
PartitionerandIntersect: Use aPartitionerto chunk theList<string>into smaller parts, allowing for more work per thread with theIntersectmethod. - PLINQ with
Partitionerand HashSet: Use aPartitionerto chunk theList<string>into smaller parts, allowing for more work per thread with aHashSet<string>.
To properly gauge the effectiveness of each solution, we constructed a microbenchmark.
Microbenchmark
Tuple<double, double, double, double> time_func(Func<List<string>, List<string>, List<string>> f, List<string> a, List<string> b, int warmup = 10, int runs = 1000)
{
    for (int i = 0; i < warmup; i++)
    {
        f(a, b);
    }

    double[] times = new double[runs];
    double min = double.MaxValue, max = double.MinValue;
    var sw = new System.Diagnostics.Stopwatch();
    for (int i = 0; i < runs; i++)
    {
        sw.Restart();
        f(a, b);
        sw.Stop();
        // In microseconds
        times[i] = sw.ElapsedTicks / (double)System.Diagnostics.Stopwatch.Frequency * 1000000;
        min = Math.Min(min, times[i]);
        max = Math.Max(max, times[i]);
    }

    double mean = times.Average();
    double std = Math.Sqrt(times.Select(x => Math.Pow(x - mean, 2)).Sum() / (runs - 1));

    return new Tuple<double, double, double, double>(mean, std, min, max);
}
This function takes the function to test f, two List<string> a and b, and the number of warmup runs and runs to perform. It then removes 1% of outliers from each end and finally reports the mean, standard deviation, minimum, and maximum time taken in microseconds.
For each of the proposed solutions, we construct a function that takes two List<string> and returns a List<string>:
List<string> original_linq(List<string> a, List<string> b)
{
    return (from x in a
        where b.Contains(x)
        select x).ToList();
}

List<string> std_linq(List<string> a, List<string> b)
{
    return a.Intersect(b).ToList();
}

List<string> compose_linq(List<string> a, List<string> b)
{
    return a.Where(b.Contains).ToList();
}

List<string> hashset_linq(List<string> a, List<string> b)
{
    var b_set = new HashSet<string>(b);
    return a.Where(b_set.Contains).ToList();
}

List<string> frozenset_linq(List<string> a, List<string> b)
{
    var b_set = new HashSet<string>(b).ToFrozenSet();
    return a.Where(b_set.Contains).ToList();
}

List<string> par_std_linq(List<string> a, List<string> b)
{
    return a.AsParallel().Intersect(b.AsParallel()).ToList();
}

List<string> par_hashset_linq(List<string> a, List<string> b)
{
    var b_set = new HashSet<string>(b);
    return a.AsParallel().Where(b_set.Contains).ToList();
}

List<string> par_std_linq_partition(List<string> a, List<string> b)
{
    return Partitioner.Create(a, true).AsParallel().Intersect(b.AsParallel()).ToList();
}

List<string> par_hashset_linq_partition(List<string> a, List<string> b)
{
    var b_set = new HashSet<string>(b);
    return Partitioner.Create(a, true).AsParallel().Where(b_set.Contains).ToList();
}
We generate two random List<string> with a varying amount of known duplicate values using the following code:
List<string> generate_strings(Random rng, int n) {
    return Enumerable
        .Range(0, n)
        .Select(_ => {
            byte[] tmp = new byte[32];
            rng.NextBytes(tmp);
            return Convert.ToBase64String(tmp);
        })
        .ToList();
}

(List<string>,List<string>) generate_string_pair(Random rng, int n, int overlap) {
    var a = generate_strings(rng, n);
    var overlap_elements = n * overlap / 100;
    var b = generate_strings(rng, n - overlap_elements)
        .Concat(a.Take(overlap_elements))
        .OrderBy(_ => rng.Next()) // Shuffle
        .ToList();
    return (a, b);
}
We then generate two List<string> with a varying amount of overlap and varying data size and perform the timing:
// Percentage of overlap; 10, 20, ..., 100.
for (int i = 1; i <= 10; i++)
{
    var overlap = i * 10;
    // 10^1, 10^2, 10^3, 10^4 elements.
    for (int j = 1; j < 5; j++)
    {
        // Earlier stopping on the last iteration to save time.
        int k_end = j == 4 ? 4 : 10;
        // Modifier to get smoother results: 10, 20, ..., 90, 100, 200, ...
        for (int k = 1; k < k_end; k++)
        {
            int n = (int) Math.Pow(10, j) * k;
            var (a,b) = generate_string_pair(rng, n, overlap);

            var original = time_func(org_linq, a, b);
            var standard = time_func(std_linq, a, b);
            ...
Microbenchmark Results
Each of the implementations has been run with 10 warmup runs and 1000 runs, except for the original and composite versions, which have been run with 5 warmup and 10 runs due to their extremely slow performance. We start by looking at the effect of each overlapping data percentage for each of the solutions:
Here we see that the effect is somewhat negligible, so to simplify the results, we will only look at the 50% overlap case.
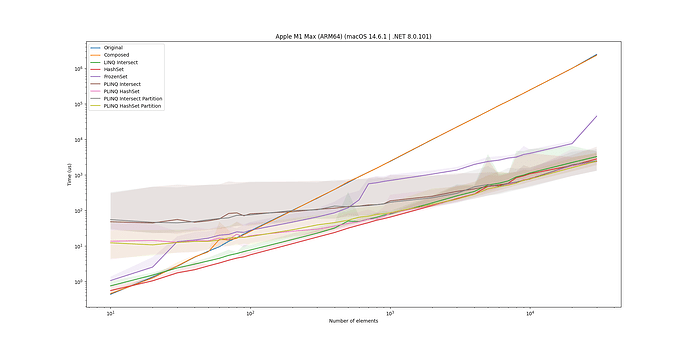
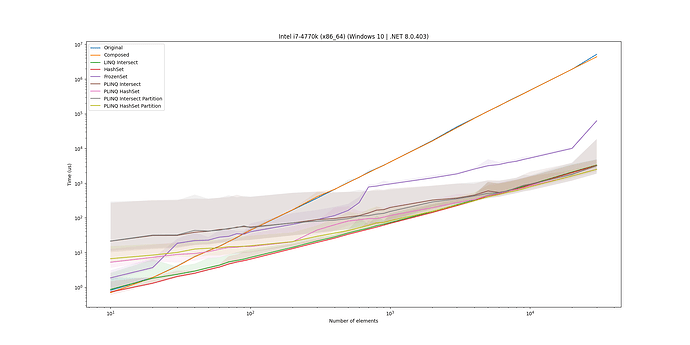
First of all, this plot cements the problem: the original solution scales very poorly and quickly becomes much worse (notice that both axes are log scale). Second, we see that using LINQ composition doesn’t change anything, which is to be expected.
The Intersect method is quite a bit faster, which is interesting since it should semantically be performing the same operation as the original query, but the LINQ engine is able to optimize the Intersect method better.
The HashSet implementation is even faster, which indicates that our hypothesis holds; the O(1) lookup time really benefits the query. Where the gap is largest (rightmost), the HashSet implementation is >1000 times faster than the original implementation.
Interestingly, the FrozenSet implementation is much slower and becomes progressively worse as the data size increases. This is likely due to the extra overhead of constructing the FrozenSet from the HashSet, which is not worth it for the potential performance gain when performing lookups for a single pass over the data.
Finally, looking at the parallel implementations, we see that when the sizes become large enough, the overhead of starting up the parallel threads is worth it, making the parallel implementations faster than the serial ones. By using a Partitioner to chunk the data, the performance is further improved, as each thread can perform more work, leading to less context switching overhead. However, each of the parallel implementations is not several times faster than the serial ones, leading to them not being worth the extra complexity, work, and resource consumption.
To provide another view of the results, we can look at the time spent per element:
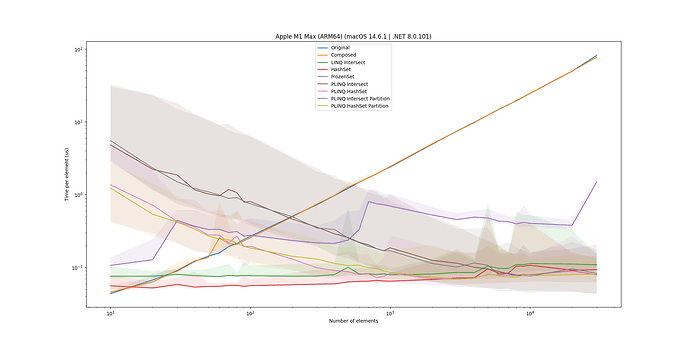
Here we see that the original (and composite) solutions become progressively worse as the data size increases, while the rest of the solutions are stable (considering after the saturation point for the parallel implementations).
The final winner is the HashSet implementation, which is the fastest and is still sequential, leading to a fast, low-resource-consuming solution. The Intersect is the runner-up, and looking into memory consumption, it might provide a lower memory footprint, but this is not within the scope of this blog post.
Microbenchmark Across Platforms
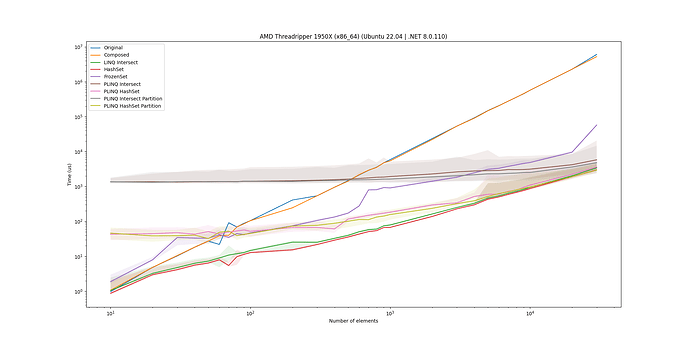
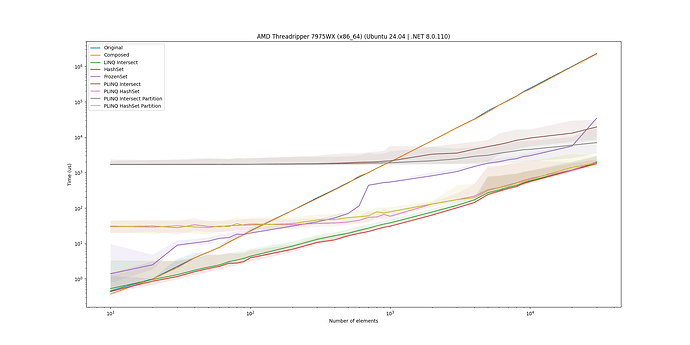
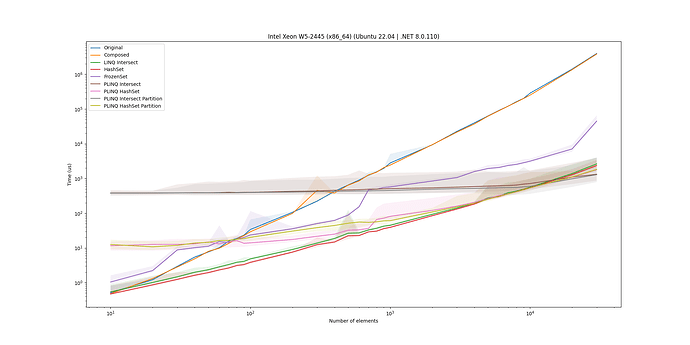
To ensure that the results are not specific to a MacBook Pro, we also ran the microbenchmark on three Linux machines and a Windows machine. For completeness, here are the plots for the 50% overlap case on these machines:
For all of them, we see that the HashSet implementation is an overall solid solution and as such is a good candidate for the solution.
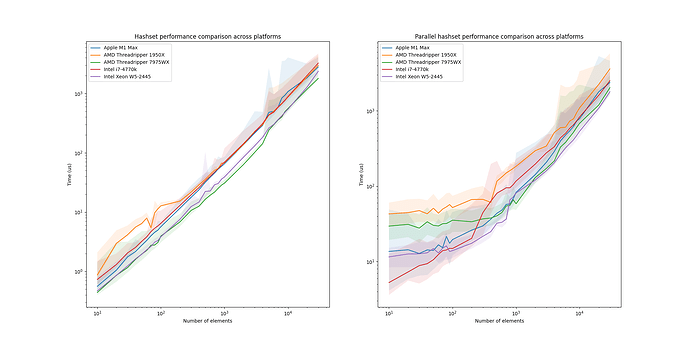
Just for the fun of it, we also plotted the scaling of HashSet and PLINQ HashSet across all platforms:
The HashSet plot is pretty much as expected, essentially ordering the implementations by age. Interestingly, for the PLINQ, the W5-2445 beats the AMD 7975WX, and the i7-4770k beats the AMD 1950X, despite both AMD CPUs having more cores than their Intel counterpart. This indicates that the Intel CPUs are better at handling the overhead of starting up the threads, which is interesting. However, that is a topic for another blog post.
Impact
Going back to the original motivation, we can now apply the HashSet implementation to the two LINQ queries in CompactHandler.cs:
List<IRemoteVolume> fullyDeleteable = [];
if (report.DeleteableVolumes.Any())
{
    var deleteableVolumesAsHashSet = new HashSet<string>(report.DeleteableVolumes);
    fullyDeleteable =
        remoteList
            .Where(n => deleteableVolumesAsHashSet.Contains(n.Name))
            .Cast<IRemoteVolume>()
            .ToList();
}

...

    List<IRemoteVolume> volumesToDownload = [];
    if (report.CompactableVolumes.Any())
    {
        var compactableVolumesAsHashSet = new HashSet<string>(report.CompactableVolumes);
        volumesToDownload =
            remoteList
                .Where(n => compactableVolumesAsHashSet.Contains(n.Name))
                .Cast<IRemoteVolume>()
                .ToList();
    }
Note that we have also added guards around the statements, as there is no need to perform the LINQ query if there are no elements in the report.DeleteableVolumes or report.CompactableVolumes.
Looking at the profiling of the compacting process, we see that the time spent on the two LINQ queries has been reduced so that they are no longer listed in the call tree. Note also how the total profiling runtime went from 1 hour 5 minutes to 45 minutes; a 20-minute (31%) reduction in total execution time.
And if we construct the same table as before, we see that the runtime has been reduced to:
dblock-size |
Runtime | Relatively slower | Speedup compared to original |
|---|---|---|---|
| 50 MB | 00:04:40.67 |
1.000x |
0.937x |
| 5 MB | 00:04:53.78 |
1.046x |
0.910x |
| 1 MB | 00:42:44.82 |
9.138x |
1.293x |
While there’s still a problem to investigate, we’ve now sped up a part of the process, which shouldn’t have been a bottleneck in the first place. Running a compact of a backup should now start up a lot faster when there are a lot of files.
Conclusion
By identifying and optimizing the LINQ queries in the DoCompact() method, we achieved a significant performance improvement. The use of HashSet for faster lookups proved to be the most effective solution, reducing the total execution time by 31%. This optimization now results in the compacting process starting shortly after generating the report indicating which volumes to compact, where the majority of the work should lie when compacting. The solution has been merged in the pull request #5595.
