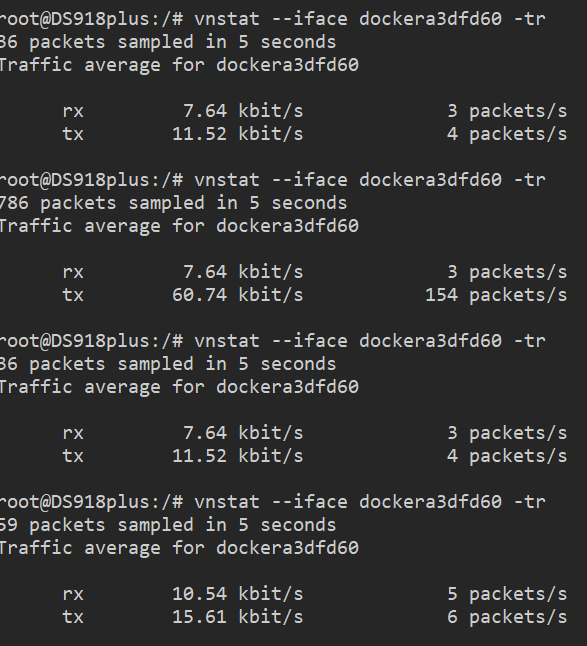
Duplicati does not report MBit/sec anywhere. It reports MByte/sec. Are you converting value to MBit/sec?
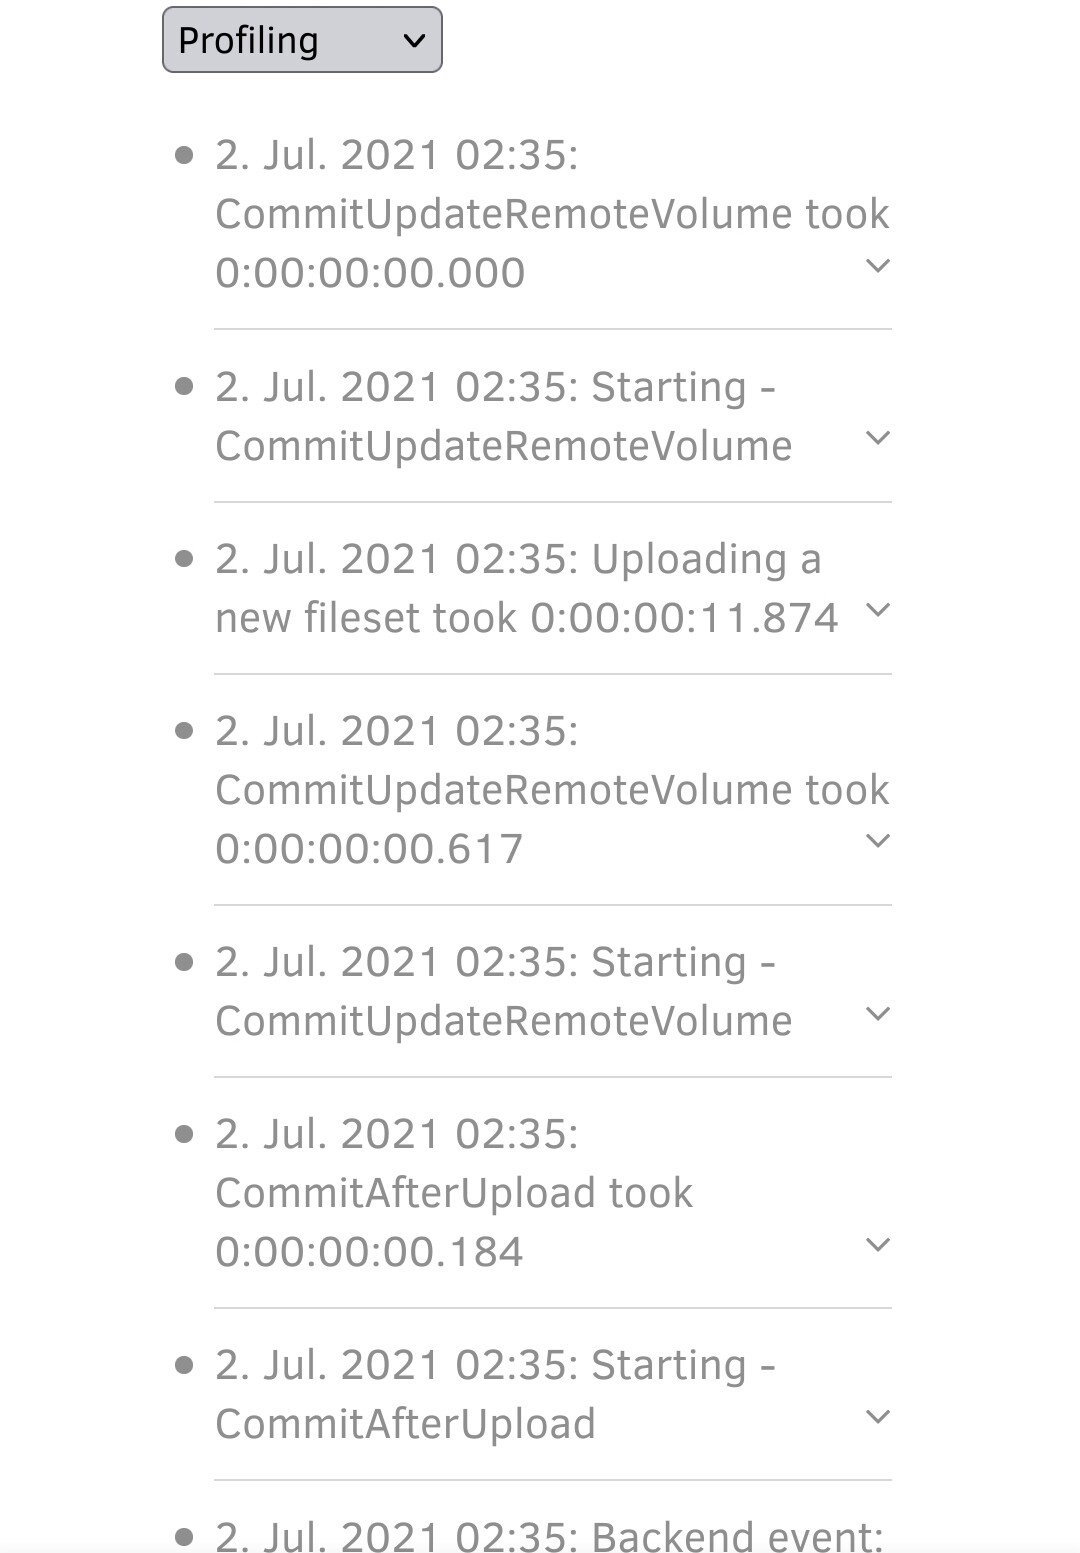
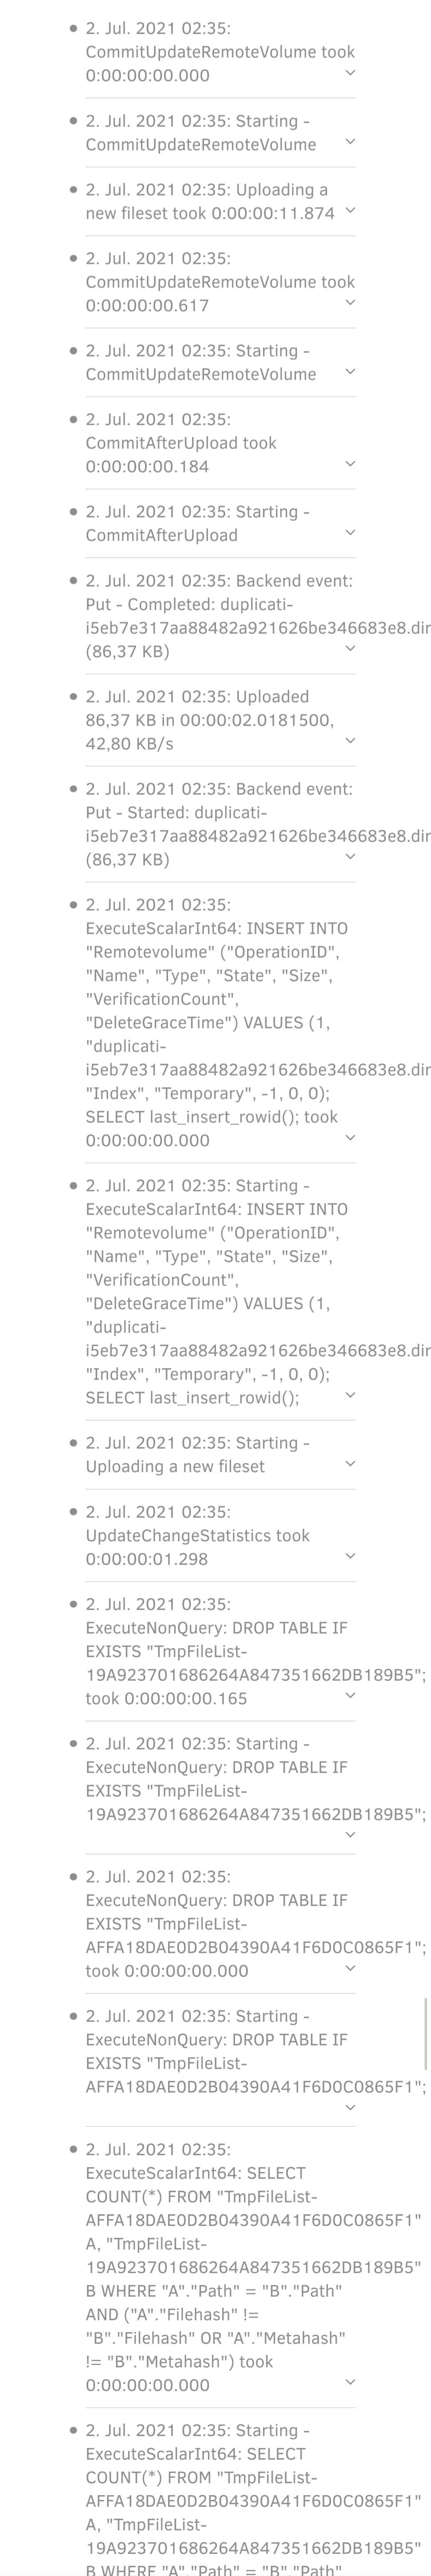
That’s the verbose live log? Profiling is a higher level, but does Synology have tools to see process stats?
For performance problems, including seeming inactivity, it’s useful to see things like level of CPU and I/O.
I don’t use Docker and I’m not sure what tools are there (too few, I think), but you can run host tools, right?
For example, is the 70-80% CPU usage happening now with the stuck log, and can you see what uses it?
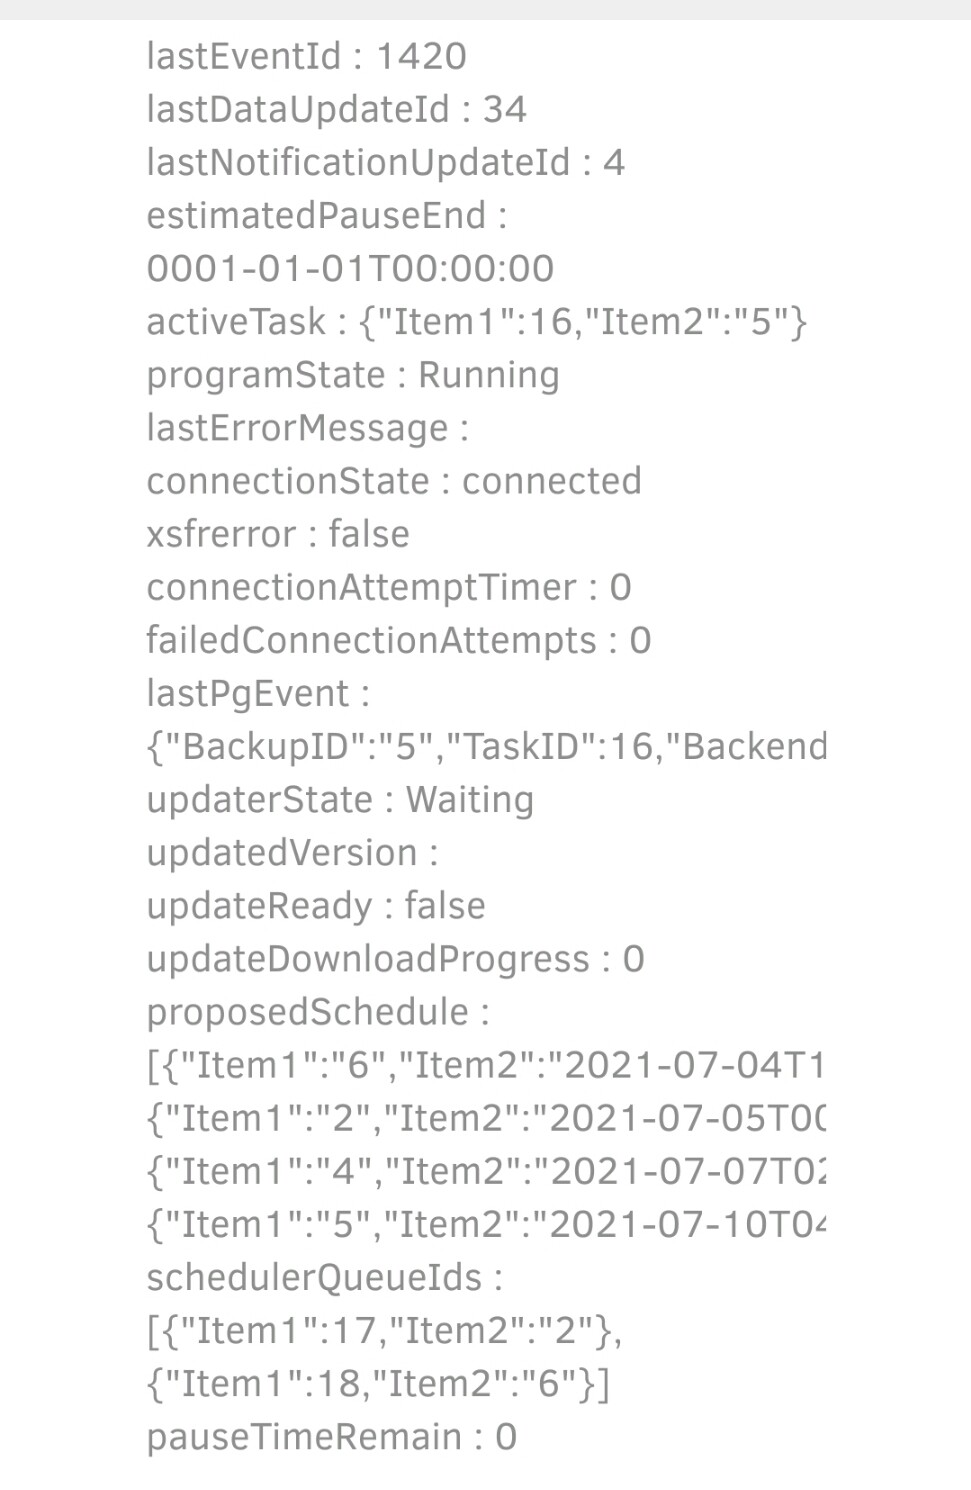
Basically, I’m not clear on the current situation. Did it move from slow to stopped? You can also look at the About --> System information screen in Server state properties to see if lastPgEvent moves.
You should be able to see its speed during uploads, although I suspect it’s the same as status bar speed.
If it’s only slow, you can try increasing parallel uploads, although by one report there was an error past 10.
  --asynchronous-concurrent-upload-limit (Integer): The number of concurrent
    uploads allowed
    When performing asynchronous uploads, the maximum number of concurrent
    uploads allowed. Set to zero to disable the limit.
    * default value: 4
You can also look in /tmp (probably) to see if there are a lot of default-50-MB files in the queue for uploads.
EU data center far slower than US data center is a Backblaze employee saying that’s only bandwidth, and explaining why multiple upload threads helps their client. On the other hand, it claims 10 Mbit/sec/thread is their (presumably system-related?) limit, and you’re far from that. Still, it’s possible that more threads help.
EDIT:
If you look in /tmp, also look over the dates on the dup-* files, e.g. ls -lcrt --full-time /tmp/dup-*.
On the Database screen, you’ll see the Local database path (hopefully mapped to persistent host file).
You’re looking for signs (via updated timestamps – there are other ways too) that somethings still moving