I’m trying to diagnose this same issue. I’m using 2.0.5.1_beta_2020-01-18 (with mono 6.12.0.122 (2020-02/c621c35ffa0 Wed Feb 10 00:51:43 EST 2021)), and the CPU usage is just through the roof, making it almost impossible to use my laptop for anything else for 5-10 minutes at a time.
I’ve already enabled --use-background-io-priority, are there any other things I can try?
Selects another thread priority for the process. Use this to set Duplicati to be more or less CPU intensive.
If you don’t mind more destination use, you might be able to reduce CPU use by compressing less:
  --zip-compression-level (Enumeration): Sets the Zip compression level
    This option controls the compression level used. A setting of zero gives no compression, and a setting of 9 gives
    maximum compression.
    * values: 0, 1, 2, 3, 4, 5, 6, 7, 8, 9
    * default value: BestCompression
Do you have usage statistics by process?
Is that the whole backup? If not, what do you notice in the UI or elsewhere when it gets worse or better?
How large is your backup? I’m curious about what Duplicati shows for Source size, Backup size, and backup versions. Also have you customized the “blocksize” setting (default is 100KiB)?
Certain backup phase operations can be slow if you have a large backup. The evaluation whether or not to do a compaction, for instance, is CPU intensive (although I think it’s single threaded).
I’ll give that a try, now set to ‘low’. I’d like to keep the compression high (I pay for online storage and it’d cost me more if compression was less aggressive).
Any tips on how to collect such stats? I do not have monitoring installed on this laptop ATM, and a prometheus exported I’d use for other circumstances feels like overkill here.
No, the back-up takes longer than that. Duplicati CPU spikes to 200, 300% and various apps are marked as unresponsive, depending on what I was trying to use at the time.
Currently:
Source:
133.06 GB
Backup:
136.33 GB / 14 Versions
No, I did not set the --block-size option; I stuck to the advice in Appendix C and left that at the default. I did set the remote volume size (--dblock-size=100MB), to take better advantage of my home fiber upload speeds.
Depends a bit on what distro you have, and what it has (or will let you get). Most likely easy tool is top.
There is also an htop that might be a little nicer, and iotop if you think disk usage may also be a factor.
Unless you have an SSD, a mechanical drive (especially a laptop one) may slow things if it gets busy.
Troubleshooting High CPU Usage in Linux is one article, but there are many others, and other tools…
Depending on tool, Duplicati can show up as mono or mono-sgen or Duplicati. There will be several.
Only one should be eating CPU time though. The first Duplicati that starts merely starts latest version.
How do you know this without having process usage statistics? What tool are you looking at to see it?
What CPU is this? On Windows, Task Manager can never show above 100% at all cores fully loaded.
Different tools may use different presentation, e.g. if you have a quad core, maybe 400% is all loaded.
I misunderstood then what you were asking for. I thought you were looking for time-series like data of CPU utilisation across a Duplicati backup run of some sort; e.g. if this was on Linux I’d have used atop. But, this is macOS, so atop is not available. iotop won’t work either, not without disabling kernel protections. It is a Macbook Pro (15", late 2018 model), so has an SSD.
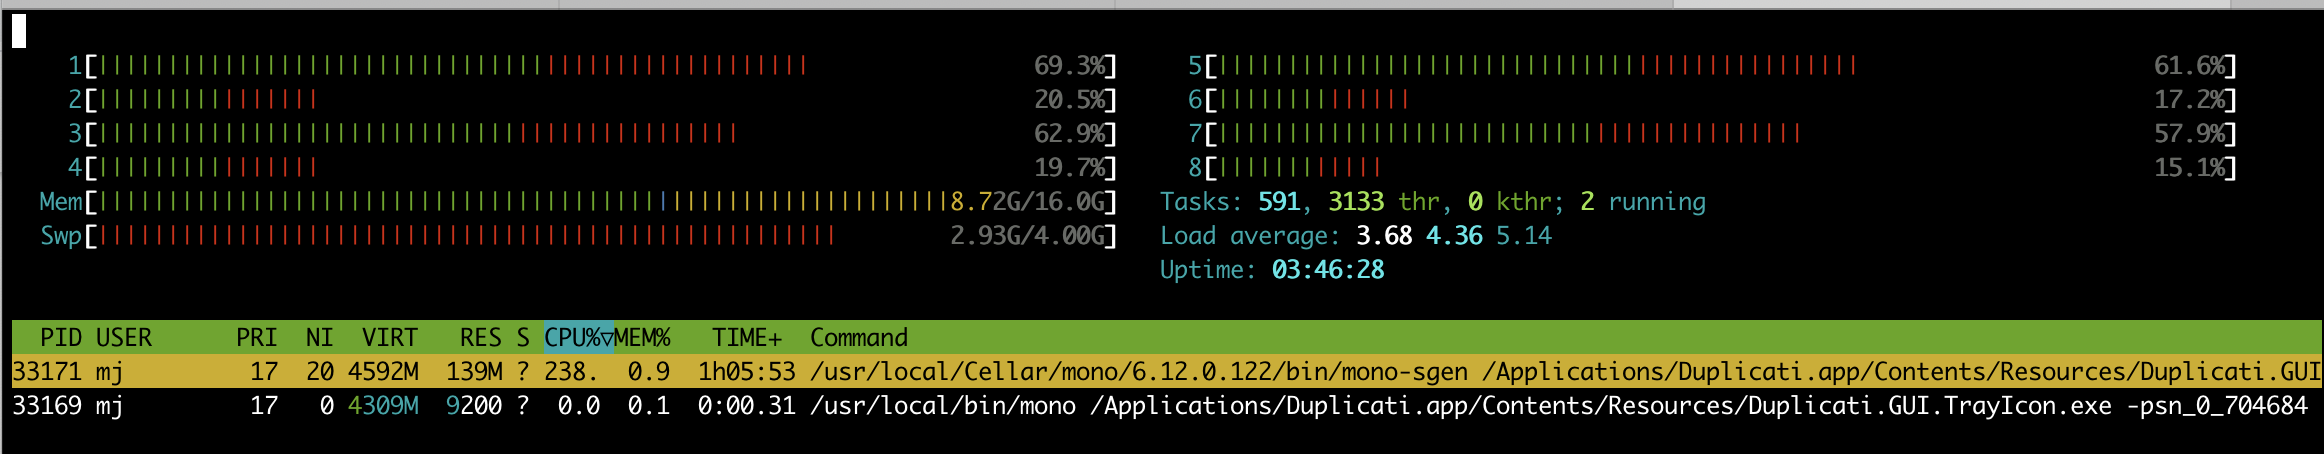
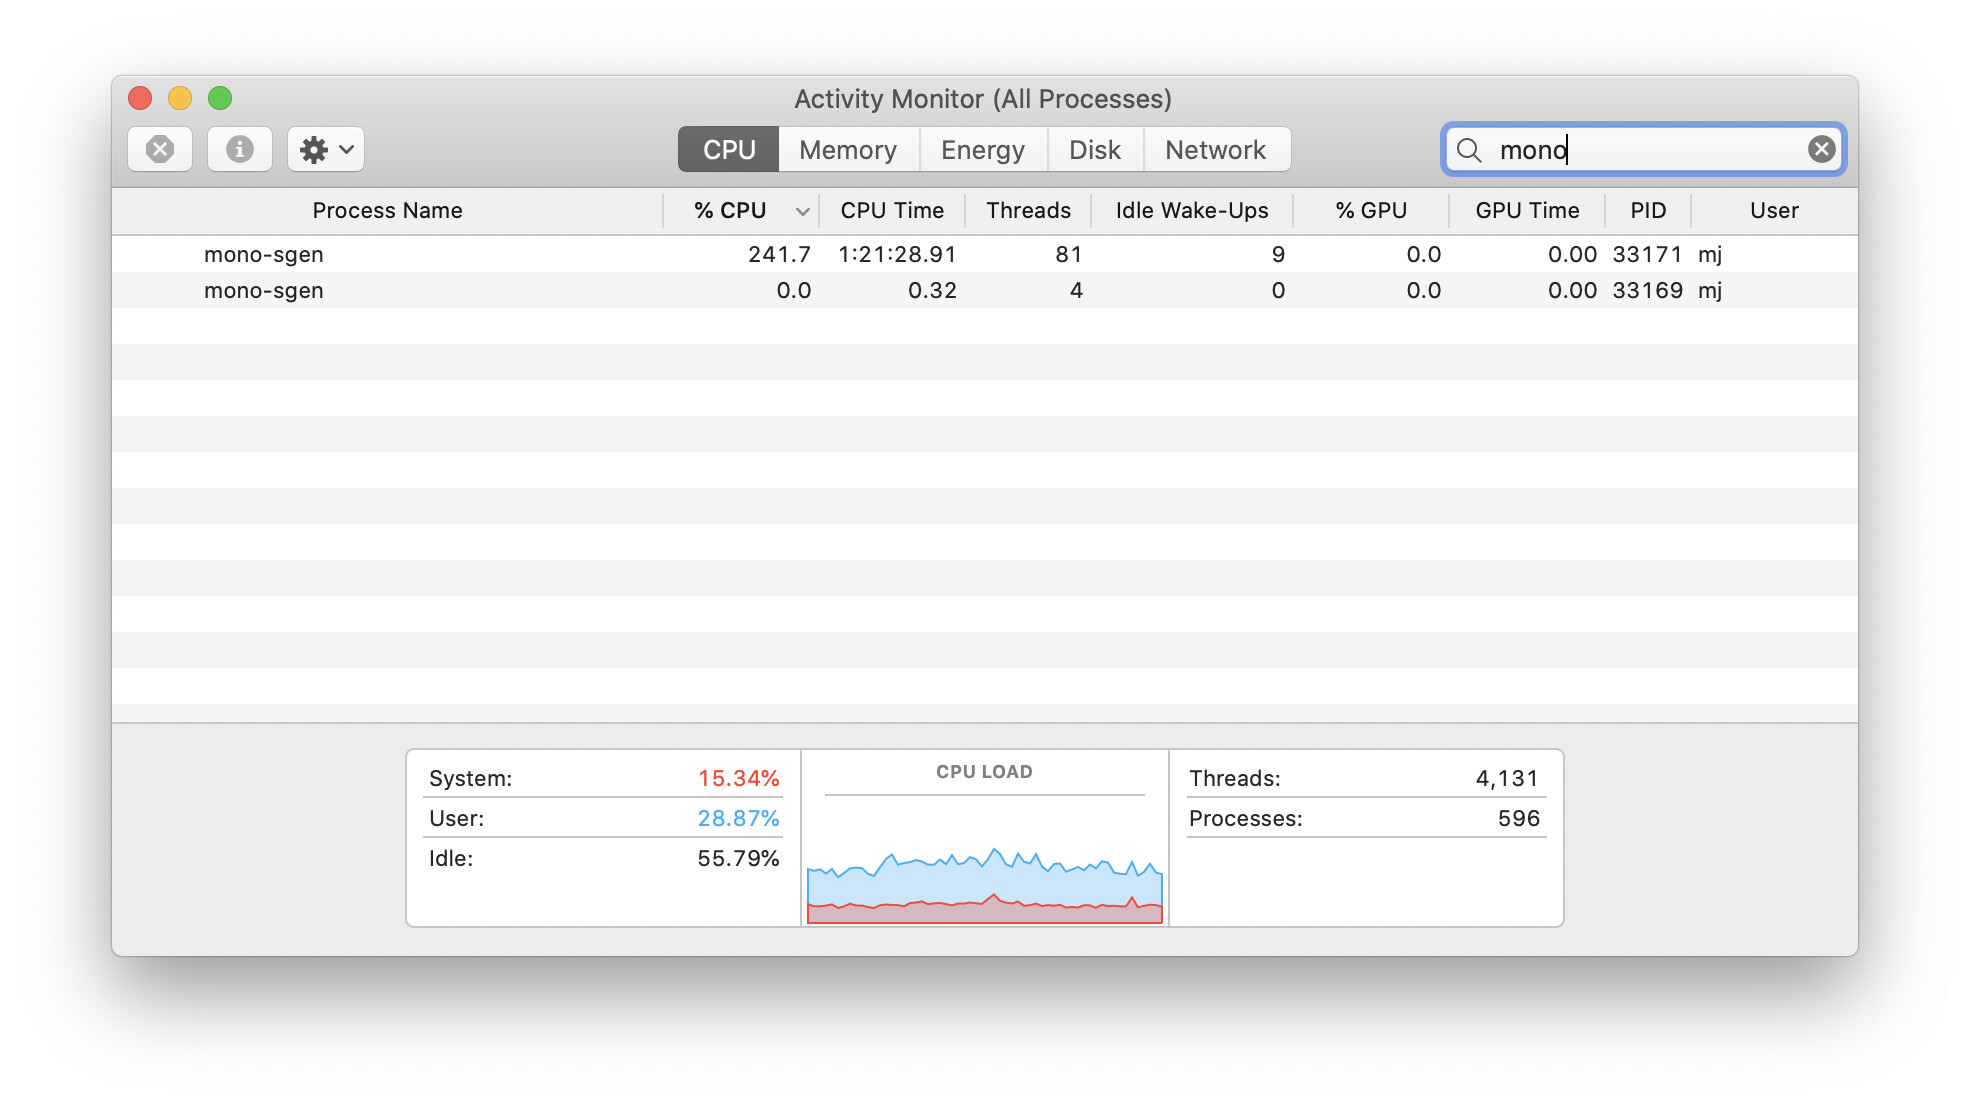
I’ve been monitoring the process with htop already, and have seen system loads over 15 minutes of 10-12 when duplicati runs.
macOS activity monitor reports CPU utilisation across all cores.
Here are some screenshots of htop and activity monitor; at this point the OS is still pretty responsive. I filtered both tools to only show processes matching mono:
I’ve been experimenting with the thread-priority and use-background-io-priority options, and with the latest beta, backups now seem to complete without too much interference.
However, I do get an error each time, triggered by the latter option I presume:
Thanks for isolating it to a process. You might be able to distinguish between user and system times.
I haven’t found a nice way to get Linux to tell me current per-process usage (probably just missing it).
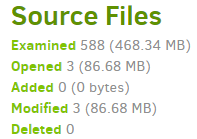
Usage over process run can be seen by below. The system spends lots of time looking through files.
That makes system load, but not a lot of CPU by process itself. I wonder if your load is file checking?
One way to tell would be to run two backups close together, with very little data backed up (see logs).
# time find / -mount -mtime 0
...
real    0m58.415s
user    0m1.175s
sys     0m5.767s
If you can’t find another tool to show user versus system time, and you need a command like above, Export As Command-line will make you one, but don’t run it at the same time as the original backup.
If you do, they will collide somewhere, maybe in database, maybe in destination, and create a mess.
Can’t find prior exact reports, but code might be the below. This is in DeactivateBackgroundIOPriority() which possibly means it’s harmless to the objective of making Duplicati lighter on system’s resources.
I don’t have macOS (and that may be a developer limitation also, if you’re seeking further investigation).
I note that the sqlite database file for this backup is 2.9G small and wonder how much that has an impact on performance.
I’m sorry to say that I am now in the process of evaluating other backup solutions that don’t have as big an impact on my laptop. I frequently find myself disabling Duplicati for the duration of my work day just to make sure I can get work done. :-/
Was there a time for the first run to compare, and can you show statistics from the job logs for both, e.g.
If the second run has very little file change, then “Opened” should get much smaller, however “Examined” should be little changed. Need to distinguish between file-finding time and actual backup time of changes.
There are other statistics in the logs, especially Complete log where “BytesUploaded” shows how much actually got uploaded. One thing to beware of when comparing runs is that sometimes a Compacting files at the backend will run and perform extra work, but it’s visible in the job log in the Compact Phase section. Setting no-auto-compact while doing performance testing can prevent compact from messing with timing.
If that’s 28 exclude options, that might slow things. You could certainly try a test with The TEST-FILTERS command to see how long it takes just to walk through all files. You could even redirect output to /dev/null provided you run from true CLI (you can Export As Command-line and edit syntax for different command).